

Tweezer Top and Tweezer Bottom Candlestick Patterns: Candlestick patterns are one of the important technical analysis tools to be prioritized by investors or traders to understand the price movement of the securities.

Tweezer Top and Tweezer Bottom is a type of candlestick pattern that identifies trend reversals and helps traders spot entry/exit opportunities in the price of a security.
Here in this article, we shall discuss in detail the meaning, formation and trade setup with the tweezer top and Tweezer bottom candlestick patterns.

What Does Tweezer Mean?
A Tweezer is a hand tool with two legs of equal length used to pick small objects with human fingers used for domestic and industrial purposes.
The Tweezer patterns are similar in structure to a Tweezer in which Tweezer tops have two candles of equal tops and Tweezer bottoms have two candles of equal bottoms formed. Hence, the name Tweezer is derived.

What are Tweezer Top Candlestick Patterns?
The Tweezer top is a type of candlestick pattern preferred by investors or traders to analyse the price movement of a security. It is a bearish reversal candlestick pattern formed at the top of an uptrend.
The pattern consists of two candles, one of a bullish green candle and another of a bearish red candle, in which the bullish candle and the bearish candle formed have equal highs or nearly equal highs.
The pattern formation with prior uptrend indicates that the uptrend is over and a downtrend in the security can be expected.

Important parts of the Tweezer Top pattern are:-
- The two candles formed are adjacent to each other.
- The pattern formation should be at the end of a prior uptrend.
- The highs of the two candles should be equal or nearly equal.
- The first candle should close higher than the previous candle.
The formation of the Tweezer Top candlestick pattern signifies that the upthrust created by bulls is over and bears have taken control over bulls. Hence a further bearishness in the price of a security can be registered.

How to trade the Tweezer Top Candlestick Pattern?
Formation of Tweezer Top candlestick pattern alerts traders or investors to set up a strategic position in security with a better risk-reward ratio.
Here we shall see how to place Entry, target and stop loss levels in a tweezer top pattern formed security.
Entry:- When a security forms a Tweezer Top candlestick pattern with a valid prior uptrend, traders can enter a short position in security after the close of a second bearish candle of the pattern formed.
Stop loss:- The stop loss for a trade with Tweezer top pattern formation in security will be the high of the first candle.
Target:- The target for a trade can be placed with a good risk-reward ratio. In this pattern formation, traders can spot a target with a 1:2 risk/reward ratio or the next support levels created by the previous swing low in the price of a security.
Also, traders can trail the stop loss to capture bigger price movements.

Chart of Bajaj Finance Ltd showing the formation of Tweezer Top candlestick pattern.
What are Tweezer Bottom Candlestick Patterns?
The Tweezer bottom is a type of candlestick pattern preferred by investors or traders to analyse the price movement of a security. It is a bullish reversal pattern formed at the bottom of a downtrend.
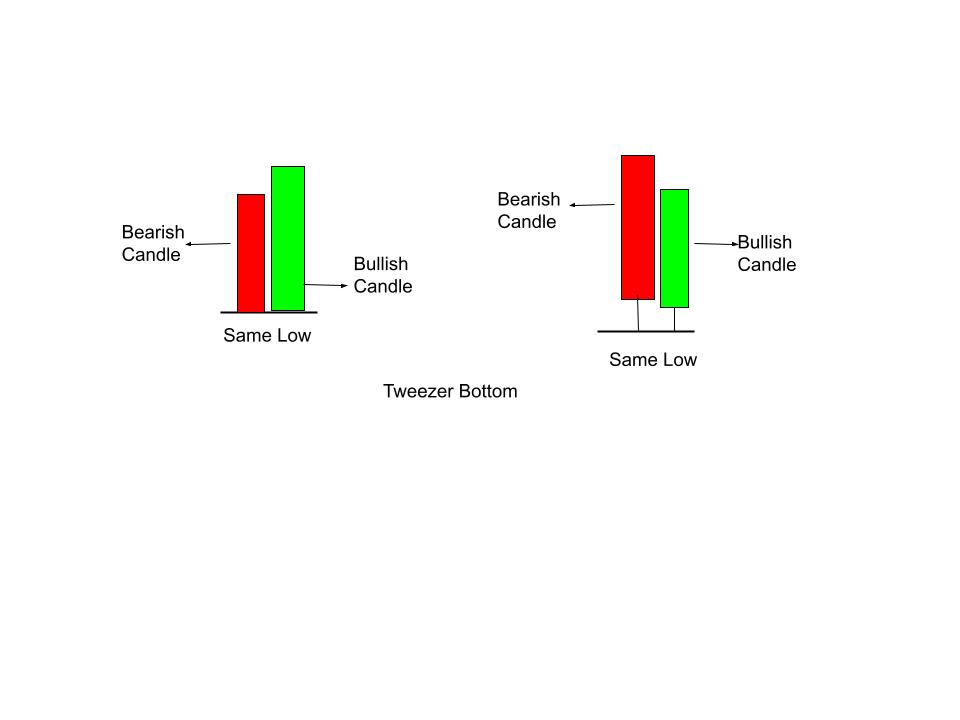
The pattern consists of two candles, one of a bearish red candle and another of a bullish green candle, in which the bearish candle and the bullish candle formed have equal lows (or nearly equal lows).
The pattern formation with the prior downtrend indicates that the downtrend is over and an uptrend in security can be expected.
Important parts of the Tweezer bottom pattern are:-
- The two candles formed are adjacent to each other.
- The pattern formation should be at the end of a prior downtrend.
- The lows of the two candles should be equal or nearly equal.
The formation of the Tweezer bottom candlestick pattern signifies that the selling pressure created by bears is over and bulls have taken control over bears. Hence further bullishness in the price of a security can be registered.
How to trade the Tweezer Bottom Candlestick Patterns?
The formation of a Tweezer Bottom candlestick pattern alerts traders or investors to set up a strategic position in security with a good risk-reward ratio.
Here we shall see how to place Entry, target and stop loss levels in a tweezer bottom pattern formed security.
Entry:- When a security forms a Tweezer bottom candlestick pattern with a valid prior downtrend, traders can enter a long position in security after the close of a second bullish candle of the pattern formed.
Stop loss:- The stop loss for a trade with Tweezer bottom pattern formation in security will be the low price level of the formed pattern.
Target:- The target for a trade can be placed with a better risk-reward ratio. In this pattern formation, traders can spot a target with a 1:2 risk/reward ratio or the next resistance levels created by the swing high in the price of a security.
Also, traders can trail the stop loss to achieve higher targets in security.

Chart of ICICI bank showing formatting of Tweezer Bottom candlestick pattern.
Note:- Traders can also consider tweezer bottom pattern lows to draw a zone of support, where bears retest the level and make an upside movement. Hence traders can exit a short position.
Pros and Cons
The formation of tweezer top and bottom candlestick patterns has its pros and cons to be understood by traders.
Pros:-
- Tweezer patterns are reliable reversal patterns that help traders spot uptrends and downtrends in security.
- The pattern formation defines support and resistance levels to identify proper breakouts and retest levels.
- As it contains only two candles to form the pattern with limited rules, it is easy to identify on charts.
Cons:-
- Highly volatile markets can generate false signals of pattern formation that can lead to wrong trades.
- A strong trend following markets can rule out pattern formation.
- To build accuracy in a trade, other indicators are preferred in conjunction with the tweezer pattern.
In Closing
Tweezer Top and Tweezer Bottom candlestick patterns are important patterns to consider for spotting valuable trend reversals and trade opportunities in securities. From the above learnings, the pattern can be employed to track the price movements and spot trades with better risk-reward ratios.
As a part of technical analysis, it is always advised to use the candlestick pattern in conjunction with other technical tools like indicators, chart patterns and so on for valid and profitable trades with good risk management.
Written By Deepak M
By utilizing the stock screener, stock heatmap, portfolio backtesting, and stock compare tool on the Trade Brains portal, investors gain access to comprehensive tools that enable them to identify the best stocks also get updated with stock market news, and make well-informed investment decisions.


