
This naturally occurring fossil fuel that powers & supports everything from industries and transportation to global trade is making rounds in the news because its fluctuations in prices have a significant influence on inflation, economic growth, and the government’s fiscal balances.
Crude oil that formed millions of years ago from the remains of microscopic organisms like plankton and algae that settled on the seabed is now worth trillions of dollars, becoming the most valuable resource on Earth today. Today, it affects and drives economies, shapes global alliances, and has even sparked wars, all because of a natural process that began millions of years ago beneath the Earth’s surface.
According to data from Trading Economics, the top crude oil-producing nations are the United States, Saudi Arabia, Russia, Canada, and China, while India ranks 22nd globally. The United States leads with a production of 13.64 million barrels per day, followed by Saudi Arabia at 9.97 million barrels per day. In comparison, India produces around 598,000 barrels of crude oil per day. One barrel of crude oil is ~159 litres. If you are wondering where Iraq, the United Arab Emirates, and Iran are ranked, they rank at 6th, 8th, and 9th positions, respectively.
WTI or Brent Crude
West Texas Intermediate (WTI) is primarily produced in the United States, especially in the Texas oil fields. It is a light, sweet crude with slightly better quality than Brent. It represents oil that is mostly used in the U.S. domestic market; however, it also influences global oil pricing.
Brent Crude is extracted from the oil fields in the North Sea, which is located between the United Kingdom and Norway. It is also a light & sweet crude similar to the WTI crude. India imports close to 85% of its crude oil, and historically, the majority of India’s oil is imported from the Middle East, Africa, and Europe, and the pricing benchmark for these regions is Brent Crude.
Rise or fall in Brent prices directly affects India’s import bill, current account deficit (CAD), inflation, and fiscal balance. WTI mainly represents U.S. oil prices and has minimal impact on India’s trade, while Brent better reflects the prices of oil that India actually imports.
Some other crude oil benchmarks and their origin regions are Dubai Crude (United Arab Emirates), Oman Crude (Oman), OPEC Reference Basket (ORB) (mix of OPEC member countries), Urals Crude (Russia), Tapis Crude (Malaysia), and Bonny Light (Nigeria).
How Crude Oil Prices are Affected
Being one of the most sensitive and closely watched commodities across the world, the key factor that affects its price is the demand-supply balance. Prices can easily rise when demand exceeds supply due to strong economic growth or a limit in production. And prices can easily fall when supply exceeds demand, which could happen because of economic slowdowns or an increase in oil production.
A key organization is OPEC (Organization of Petroleum Exporting Countries), which is an intergovernmental organization created at the Baghdad Conference in 1960 by Iran, Iraq, Kuwait, Saudi Arabia, and Venezuela. Current member countries include Algeria, Congo, Equatorial Guinea, Gabon, Iran, Iraq, Kuwait, Libya, Nigeria, Saudi Arabia, the United Arab Emirates, and Venezuela.
It was primarily founded to coordinate and manage oil production levels, to prevent extreme price volatility in global oil markets, and to protect the interests of oil-producing nations. It currently controls around 35% of the world’s oil supply. When oil prices fall sharply, OPEC often cuts production to reduce supply and push prices up. And when prices rise too high, they may increase production to stabilize the market and maintain demand.
Oil-producing regions in the Middle East are often affected by wars, civil conflicts, sanctions, and political instability. Sanctions and conflicts in major producers like Iran and Russia, or attacks on oil infrastructure, disrupt supply and lead to price volatility.
Further, during recessions and slowdowns in the economy, demand drops that lead to lower crude prices, and during economic growth, industries expand and fuel consumption rises, increasing prices. Currency fluctuations in the U.S. dollar, as global oil is traded in U.S. dollars, also influence prices. A weaker dollar makes oil cheaper for other countries, which leads to an increase in demand.
Impact of Crude Oil on the Indian Economy
Crude oil has a very important role in any economy’s stability and growth. India, as one of the world’s largest consumers and importers of crude oil, is heavily dependent on it, and any fluctuations in international oil prices have a direct impact on inflation, fiscal health, and overall performance of the economy. 5 important economic parameters that directly affect crude oil prices are Inflation, Fiscal Deficit, Current Account Deficit (CAD), Currency value, and the Government’s Budget and revenue.
The impacts discussed below are sustained only when crude oil prices remain elevated for a prolonged period above its mean. Short-term fluctuations may cause temporary volatility but usually do not lead to lasting economic effects.
Inflation: Crude oil directly affects the cost of transportation and production. As crude oil prices rise, it increases the logistics cost for goods, which leads to higher retail inflation, especially in food and essential commodities. On the contrary, falling oil prices help ease inflation pressure.
Fiscal Deficit: This is the difference between a government’s total expenditure and its total revenue for a particular fiscal year. When oil prices rise and are sustained at that level, government fuel subsidies increase, putting pressure on the fiscal deficit. The government also earns less from taxes if it cuts duties to control fuel prices
Current Account Deficit (CAD): This occurs when a country’s total imports of goods, services, and transfers are greater than its total exports. That also means that the country is spending more foreign currency than it earns. A higher CAD could depreciate the rupee, making imports even more expensive.
Currency Value: Rising crude oil prices increase the import cost, which leads to an increase in demand for U.S. dollars, which weakens the rupee. So, a weaker rupee further raises the import costs
Government’s Budget and Revenue: Oil tax revenue significantly contributes to the government’s tax revenue through VAT, excise duties, and others. When the crude prices fall, tax collections could drop if the government passes the dropped prices’ benefit to consumers. Similarly, when prices rise, the government sometimes absorbs some part of the crude price increase by reducing taxes, directly impacting the government’s revenue.
Sectors Negatively Affected by Rising Crude Oil Prices
The impacts discussed below are sustained only when crude oil prices remain elevated for a prolonged period above its mean. Short-term fluctuations may cause temporary volatility but usually do not lead to lasting economic effects.
Aviation: Any airline’s major shares of operating costs come from Aviation turbine fuel (ATF). When crude prices rise, fuel costs increase, which leads to low profit margins. Key listed payers: IndiGo and SpiceJet
Logistics: Freight that is goods transported in bulk by truck, train, ship, or aircraft. Companies operating in this segment are directly affected as higher fuel costs affect the freight costs. Key listed payers: Blue Dart Express, Delhivery, VRL logistics, TCI Express
Paints & Chemicals: Crude oil is a key raw material for petrochemical derivatives used in paints, coatings, and plastics. Rising prices increase input costs for these companies, reducing profit and margins. Key listed payers: Asian Paints, Berger Paints, Kansai Nerolac, Pidilite Industries, Aarti Industries
Tyre & Rubber: This industry experience a double cost impact. Crude derivatives that are synthetic rubber and carbon black become costlier, raising production expenses. They are also affected by transportation expenses, as their output, i.e tyres, are bulky goods that require significant logistics and fuel use for transportation from factories to wholesalers. Key listed payers: MRF, Apollo Tyres, CEAT, Balkrishna Industries
Sectors Positively Affected by Rising Crude Oil Prices
(Upstream) Oil Exploration & Production: Companies that are into crude oil exploration directly benefit from price increases since they sell crude at higher prices, improving their revenues, profitability, and margins. Key listed payers: ONGC, Oil India, Vedanta Limited
Oilfield services & equipment providers: Companies that provide drilling, engineering, or field services for oil exploration & production companies see higher demand when these companies ramp up exploration due to profitable price levels. Key listed payers: Engineers India, Deep Industries, and Alphageo India.
Renewable Energy Sector: Rising oil prices make renewable energy sources like solar, wind, and biofuels more attractive and competitive, which also increases investment and policy support in clean energy. Key listed payers: Adani Green Energy, Suzlon Energy, NHPC, Waaree Energies, and Vikram Solar.
(Downstream) Refineries: They have a conditional impact; these refinery companies could benefit if their crack spread, which represents the profit margin of the refiners, increases, which depends on the ability to pass higher costs to consumers. The crack spread is the difference between the price of crude oil and the price of the refined products derived from it, such as petrol, diesel, and jet fuel. It essentially represents the profit margin for refineries; the higher the crack spread, the more profitable it is for the refiners. Key listed payers: IOC, BPCL, HPCL.
Crack spreads increase when the prices of refined products rise faster than crude oil prices. Vice versa, when crude oil prices rise sharply or product demand weakens, the crack spread narrows, reducing margins.
Chart Analysis of Crude Oil
Log chart has been taken for Brent Crude Oil (UKOIL) from 1975 to the current period here, instead of a linear chart, because the log chart shows moves based on percentages, not on absolute amounts. When prices double from ₹10 to ₹20 or from ₹100 to ₹200, both are 100% moves. In the log chart, both moves look the same size because both are 100%. In a normal or linear chart, the ₹100 to ₹200 move looks 10x bigger on screen because it’s a ₹100 move vs a ₹10 move.
A further monthly line chart has been taken, as it would reduce the daily and weekly noises, and it further smooths out short-term volatility and highlights major structural trends (booms and crashes).
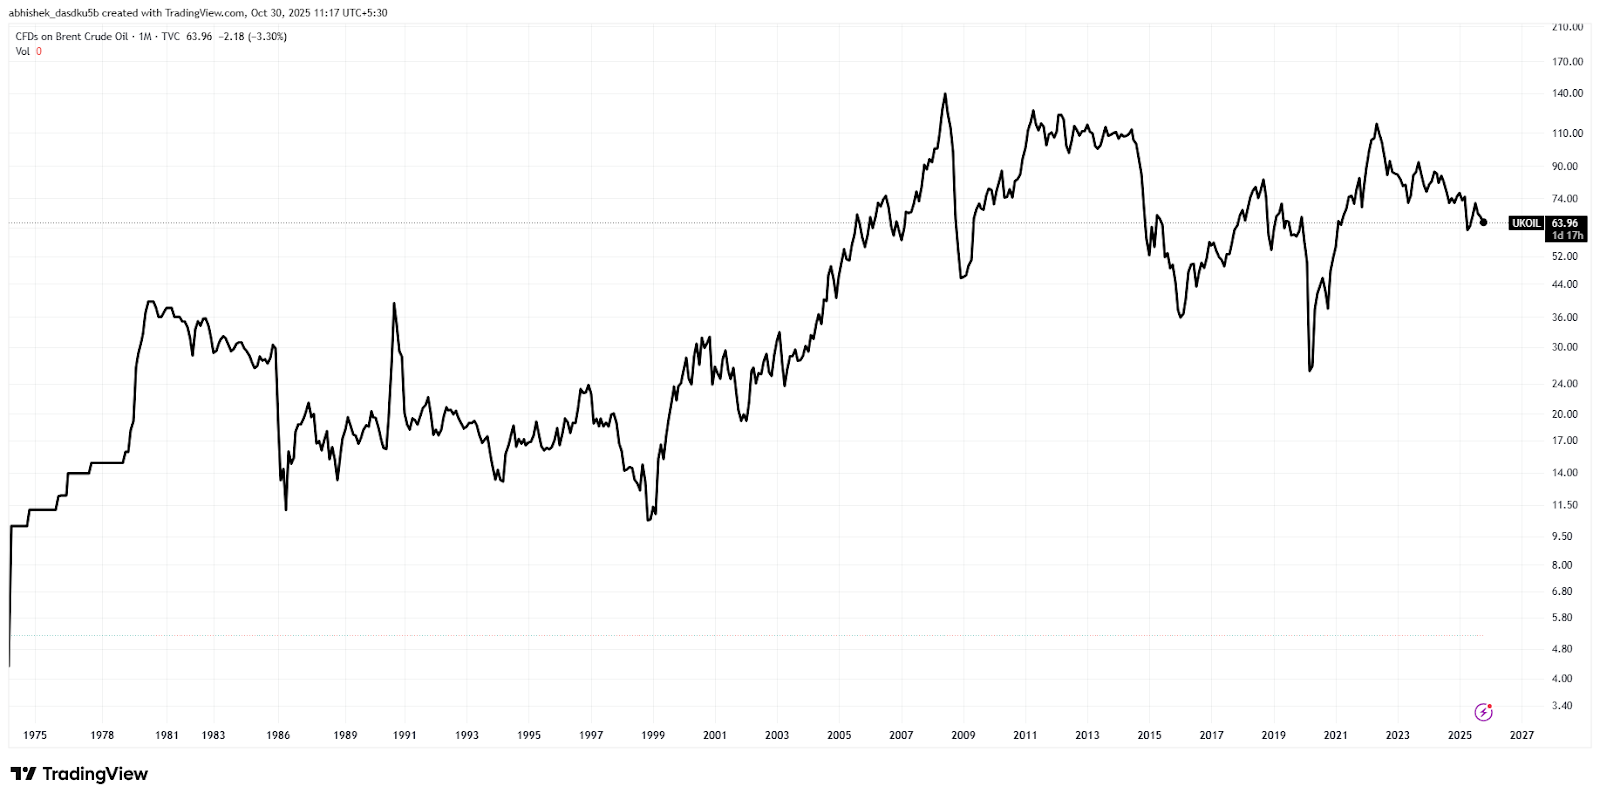
Historically, rather than showing a steady, long-term trend, Brent crude prices have moved within a broad but recurring range, showing high volatility and cyclical swings.
Over the past 4 decades, from 1985 to 2025, prices typically oscillated between $20 and $120 per barrel, rarely sustaining outside this zone for long.
The market shows a boom and bust rhythm, where sharp rallies are followed by equally steep declines. During uptrends, prices often rise exponentially as global demand tightens or supply disruptions occur, leading to excited peaks. However, these surges are hardly stable. Once high prices attract additional production or weaken production, they trigger a reversal, pulling prices lower.
Brent crude tends to mean-revert around a central value band, commonly between $50 and $70 per barrel. This range acts as a long-term equilibrium where supply and demand remain balanced.
In crux, Brent crude’s price history reflects a sideways market with a high magnitude of explosive growth and collapse within a long-term horizontal structure.
In conclusion, crude oil is not a linear asset that compounds value over time; instead, it is governed by cycles of excess and correction.
Written By: Abhishek Das
Disclaimer

The views and investment tips expressed by investment experts/broking houses/rating agencies on tradebrains.in are their own, and not that of the website or its management. Investing in equities poses a risk of financial losses. Investors must therefore exercise due caution while investing or trading in stocks. Trade Brains Technologies Private Limited or the author are not liable for any losses caused as a result of the decision based on this article. Please consult your investment advisor before investing.
