

Double Top and Double Bottom Chart Patterns: Every trend no matter how significant it is eventually comes to an end. At the end of these trends lies a trading opportunity for reversal. In order to take advantage of these opportunities one has to be able to identify the reversals patterns in the price of the security.

While there are various technical tools that can help one in identifying reversals in the market, chart patterns are a classic way to do so. In this article, we will discuss the double top and double bottom chart patterns, which serve as effective tools for identifying these reversals.
What is Double Top Chart Pattern?
A double top is a bearish reversal pattern that is made up of two highs that are separated by a pullback in the middle which is the neckline/support level of the pattern.

The first peak is formed after a strong bullish trend which is followed by a pullback which acts as a support level for the pattern. The pullback is once again followed by a bullish trend which forms the second peak of the pattern.
The formation of this pattern indicates that the bullish momentum is weakening and the uptrend is coming to an end. Once the price breaks below the neckline level, the bearish trend tends to continue for a medium to a long period of time.

Trading Using the Double Top Pattern
Following are the steps to follow in order to trade a Double Top Pattern:
Entry: When the price of the security falls below the support line/neckline of the pattern which is separating the two highs, you should open a short position in the security as it indicates a bearish reversal.
When the price breaks below the neckline/ support line of the pattern, it is better to have an expansion in the volumes as it adds conviction to the bearish reversal in the price of the security.

Profit Target: The profit target for this pattern should be equal to the distance between the highest point in the pattern and its support level. Once the market reaches the target level, depending upon the momentum, you can either book your profit or trail you stop loss to first Resistance.
Stop Loss: The neckline line of the chart pattern serves as the trigger for stop-loss while trading using this pattern. If the price rises above the neckline, then all the short positions entered must be squared off.

What is Double Bottom Chart Pattern
A double top is a bullish reversal pattern that is made up of two lows that are separated by a pullback in the middle which is the neckline/resistance level of the pattern.
The first trough/low is formed after a strong bearish trend which is followed by a pullback which acts as a resistance level for the pattern. The pullback is once again followed by a bearish trend which forms the second trough/low of the pattern.
The formation of this pattern indicates that the bullish momentum is weakening and the downtrend is coming to an end. Once the price breaks above the neckline level, the bullish trend tends to continue for a medium to a long period of time.
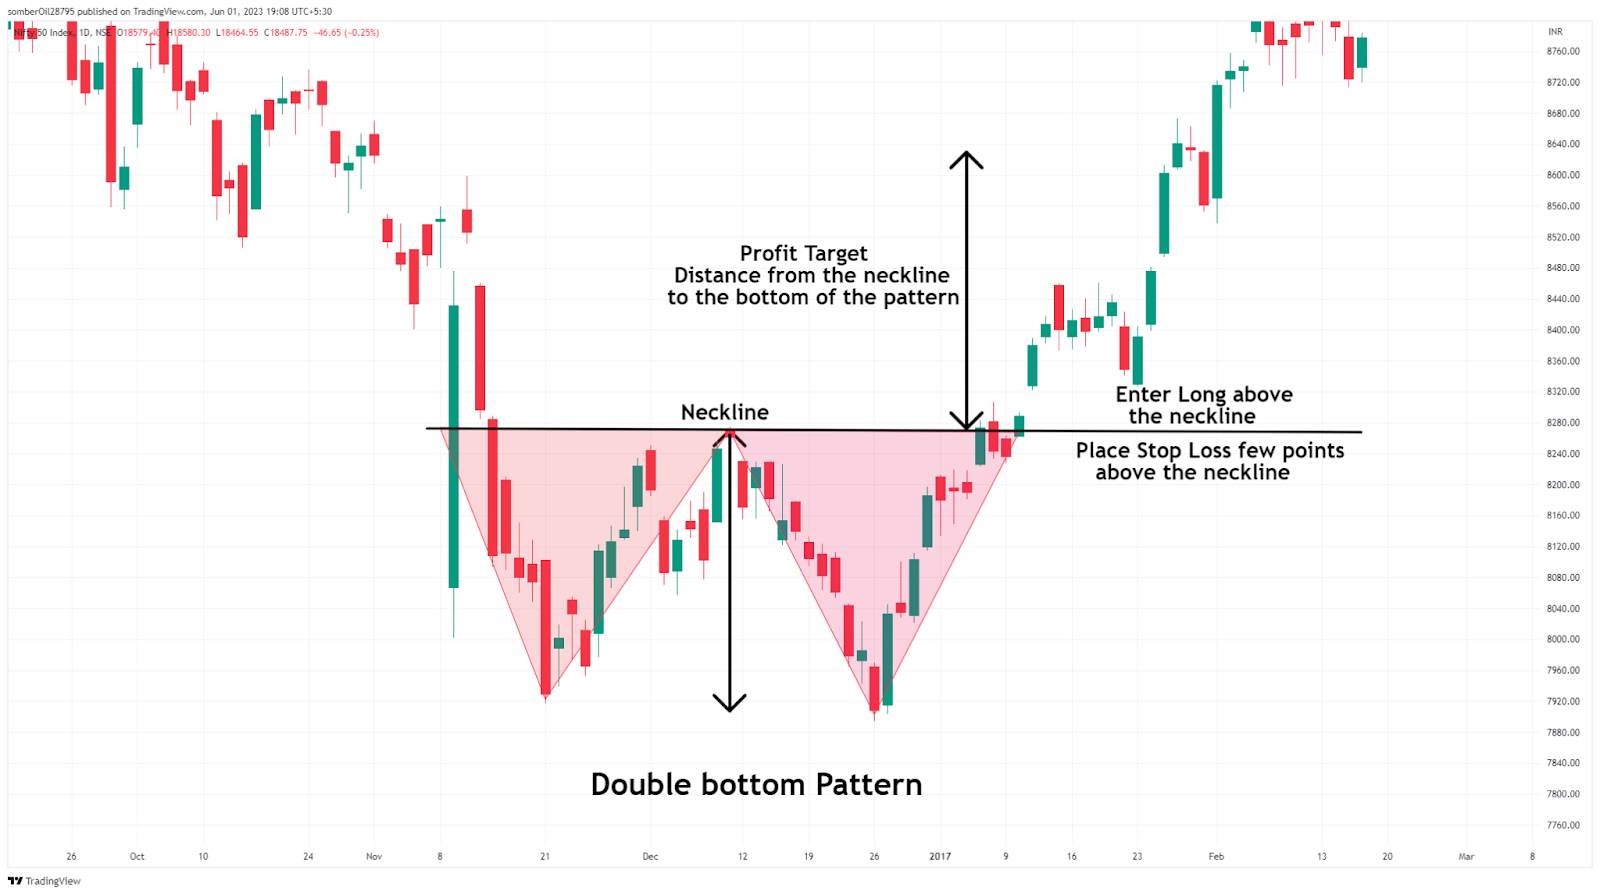
Trading Using the Double bottom Pattern
Following are the steps to follow in order to trade a Double bottom Pattern:
Entry: When the price of the security rises above the resistance line/neckline of the pattern which is separating the two lows, you should open a long position in the security as it indicates a bullish reversal.
When the price breaks above the neckline/ resistance line of the pattern, it is better with an expansion in the volumes as it adds conviction to the bullish reversal in the price of the security.
Profit Target: The profit target for this pattern should be equal to the distance between the lowest point in the pattern and its Resistance level. When the price meets the calculated distance, you can book profits from the trade.
Stop Loss: The neckline line of the chart pattern serves as the trigger for stop-loss while trading using this pattern. If the price rises below the neckline, then all the long positions entered must be squared off.
Key Elements of Double Top and Double Bottom Chart Patterns
Now that we have understood the meaning of double top and double bottom chart patterns, let’s summarize the key elements of these patterns, which are crucial for identifying potential reversals and seizing trading opportunities.
Prior Trend: For a double-top pattern, there should be an uptrend in the price of the security before the formation of the pattern, characterized by higher highs and higher lows.
In the case of the double bottom pattern, there should be a prior downtrend which is characterized by lower lows and lower highs.
Two Peaks/lows: The double-top pattern comprises two peaks that are roughly the same level and act as a resistance level from where the price may likely reverse.
The double-bottom pattern comprises two lows that are roughly the same level and act as a support level from where the price may likely reverse.
Trough/Peak in the middle: The double-top pattern will consist of a trough which separates the two peaks and indicates a brief period of consolidation.
The double bottom pattern will consist of a peak which separates the two lows and indicates a brief period of consolidation.
Neckline: The trough in the double-top pattern helps in the formation of a neckline which is a horizontal line that serves as a level of support. The price should break the support line for the confirmation of the pattern.
The peak in the double-top pattern helps in the formation of a neckline which is a horizontal line that serves as a level of resistance. The price should break the resistance line for the confirmation of the pattern.
Volume: Volumes can be a significant aspect in the double-top and double-bottom chart patterns. The volumes tend to decrease during the formation of the two highs or the two lows. This is followed by an increase in volumes when the price breaks the neckline for both chart formations.
Price Goal: For a double top formation, the reference point for price decline after the breakdown can be the distance from the highest point to the neckline of the pattern.
For a double bottom formation, the reference point for price decline after the breakout can be the distance from the lowest point to the neckline of the pattern.
In Closing
As we conclude our article on Double Top and Double Bottom chart Patterns, it is important that though these patterns easily provide entry and exit levels in security, they might not work every time. Thus, it is better to use these patterns with the combination of other technical indicators which can help to predict the reversals more accurately.
Written By Aaron Vas
By utilizing the stock screener, stock heatmap, portfolio backtesting, and stock compare tool on the Trade Brains portal, investors gain access to comprehensive tools that enable them to identify the best stocks also get updated with stock market news, and make well-informed investment decisions.


