

Price Volume Trend Indicator: Decoding the language of price movements and trading volume in financial markets is equivalent to decoding the mysteries of market dynamics. Among the numerous technical indicators, the Price Volume Trend (PVT) stands out as a distinctive tool that can help you relate to security price and trading volume.

In this article, we are going to discuss the Price Volume Trend Indicator and also see how traders can use this indicator.
What is the Price Volume Trend Indicator?
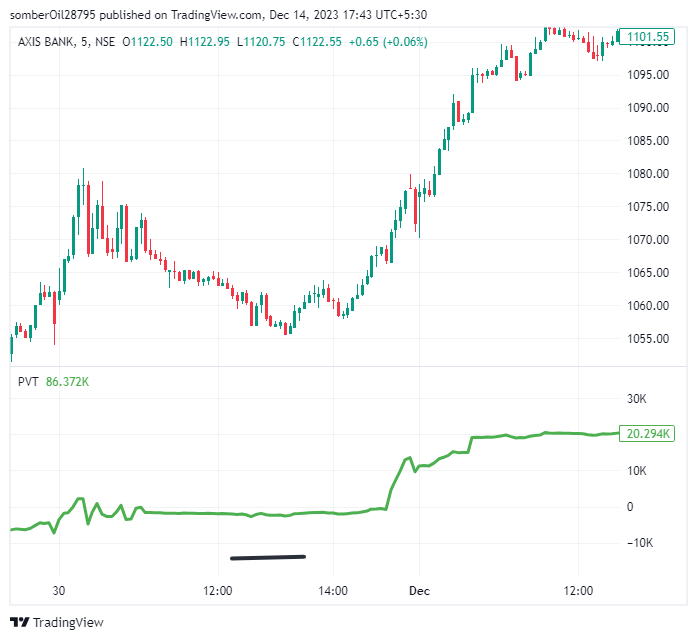
The price volume trend indicator is a volume-based technical analysis tool that helps traders relate a security price to its trading volume.

It is useful in identifying the parity between the supply and demand of a security and also helps one determine the price of a security’s price direction and strength of price change.
The indicators consist of a cumulative volume line that adds or subtracts a multiple of the percentage change in a security’s price and current volume, depending upon the upward or downward movement in the security.

Price Volume Trend Indicator – Formula
The basics behind the indicator is to multiply the volume of the security by the percentage change in the security price.
PVT= Previous PVT + Volume x {(Today’s closing price – Previous closing price)/previous closing price}
Where, PVT= Price Volume Trend

The indicator’s value rises with the price of the security and falls when the price decreases.
Interpretation of Price Volume Trend indicator
Unlike indicators like MACD or RSI, there is no clear signal that indicates that the security is in an overbought or oversold condition. Instead, traders determine the momentum of the security by analysing its overall trend along with the changes in the PVT indicator.
An increase in the PVT indicator indicates that money is flowing into the security. Whereas, a decrease in the PVT indicates that money is flowing out of the security.
Though this indicator gives an idea about the money flowing in and out of the security, how can you identify an uptrend or a downtrend using this indicator?
This is where the signal line comes into play. The signal line is nothing but the 21-period simple moving average you add to the PVT indicator.
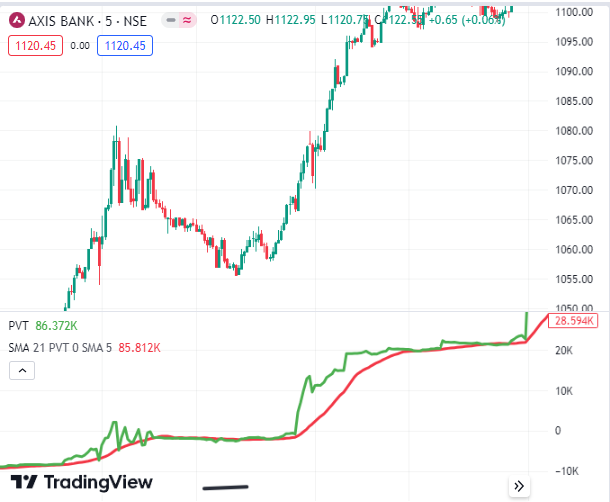
To apply the signal line to the PVT indicator, follow the following steps:
- Step 1: Click on the more option on the PVT indicator section
- Step 2: Select ‘Add indicator/strategy on PVT’
- Step 3: Search and select the ‘Moving Average Simple’
- Step 4: Change the length of the SMA to 21 and select the colour according to your preference.
Here, we will set the colour of the PVT line as green and the signal line as red in order to easily identify the trades in the security.
Trading with Price Volume Trend Indicator(PVT)
Following are the ways in which one can use Price Volume Indicator along with a signal line to enter trades in the market
Signal Line Crossover Strategy
In this strategy, you enter a trade depending on the Price trend indicator crossing above or below the signal line. The indication for the bullish or the bearish signal and the way to trade them are given below:
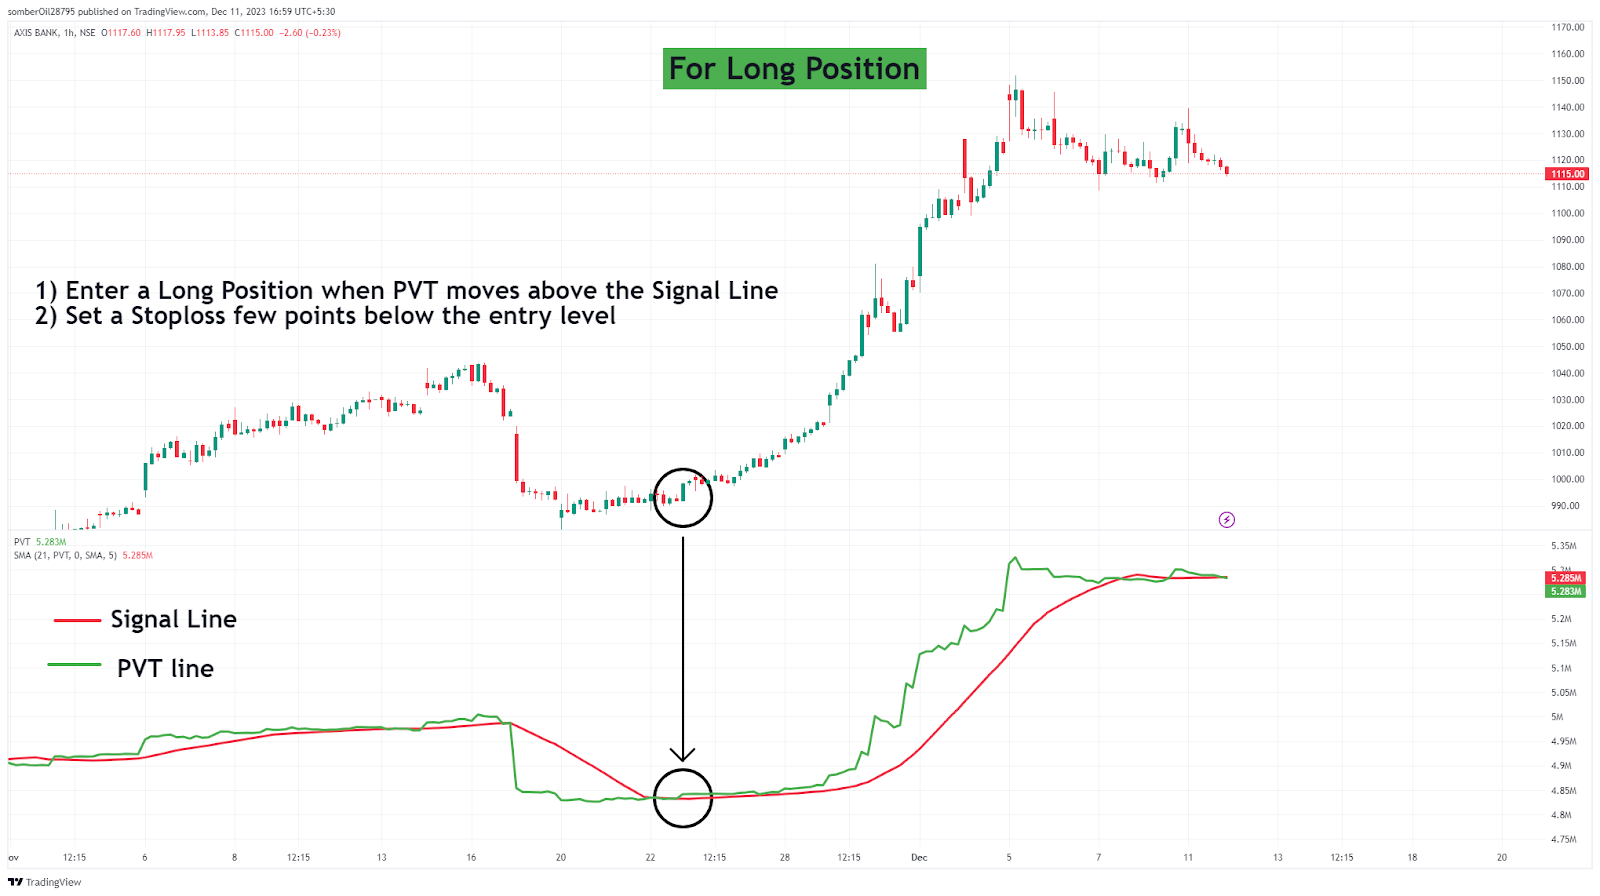
Bullish Signal
When the Price Volume Trend Indicator Crosses above the signal line, it is an indication of a bullish trend in the security.
Entry: When the PVT Indicator (green line) crosses above the signal line (red line), one can enter a long position in the security.
Profit Target: One can ride in the security until the PVT line closes below the signal line or until you hit the trailing stop loss (whichever comes first)
Stop Loss: The Stop loss for this trade can be the immediate level of support and can be trailed once the trade starts to move in your favour.
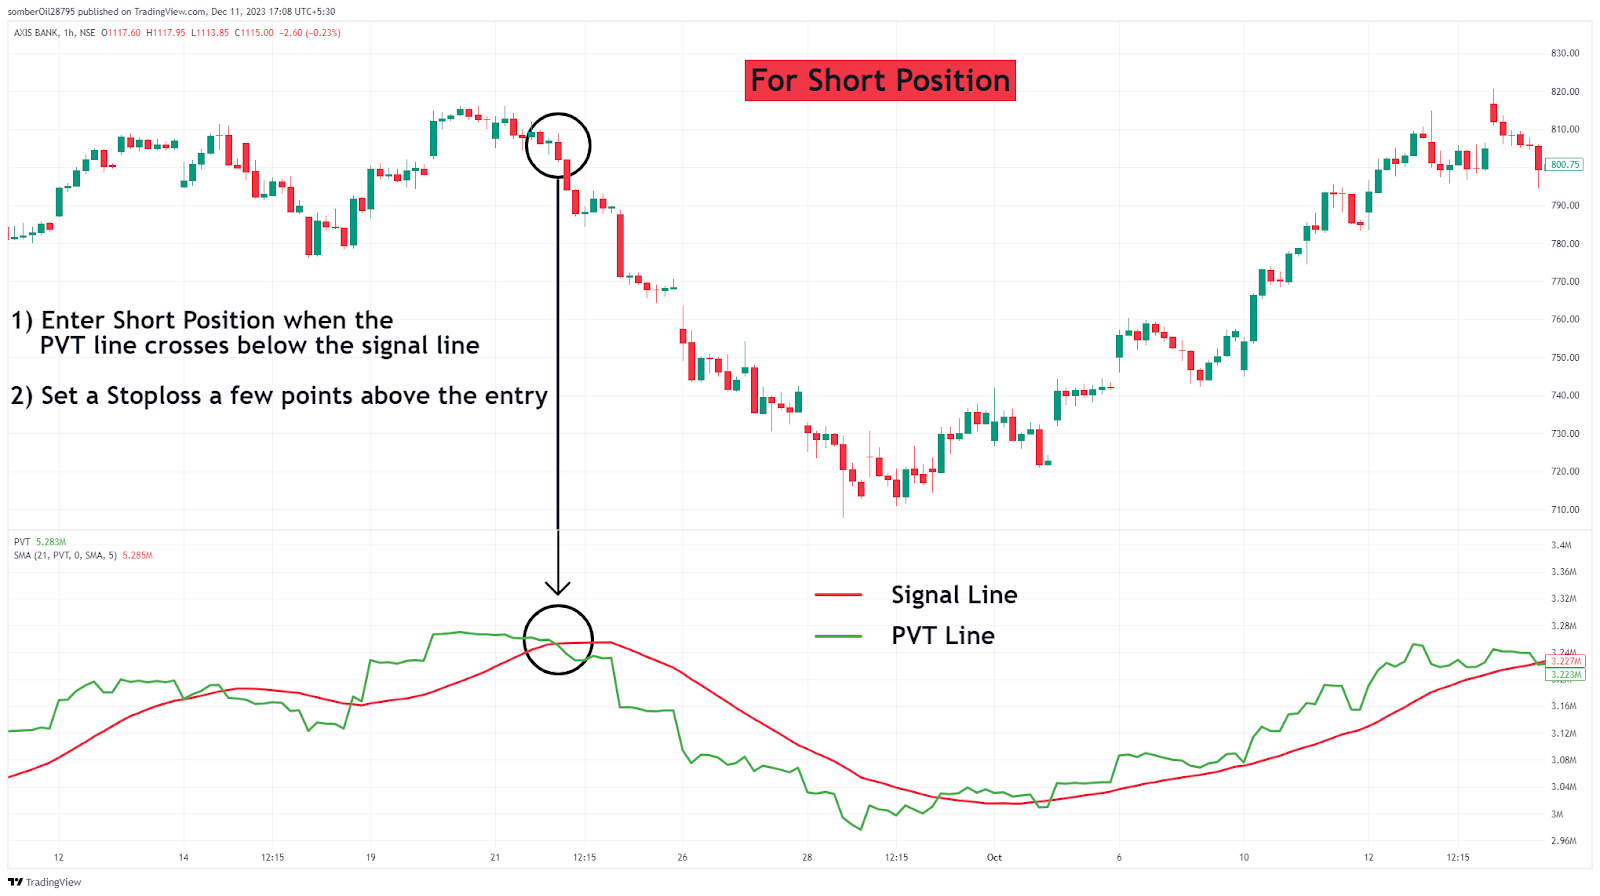
Bearish Signal
When the Price Volume Trend Indicator Crosses below the signal line, it is an indication of a bearish trend in the security.
Entry: When the PVT Indicator (green line) crosses below the signal line (red line), one can enter a short position in the security.
Profit Target: One can ride in the security until the PVT line closes above the signal line or until you hit the trailing stop loss (whichever comes first)
Stop Loss: The Stop loss for this trade can be the immediate level of Resistance and can be trailed once the trade starts to move in your favour.
Divergence Strategy
Divergence refers to a situation where the security and Price volume indicators move in opposite directions. This is an indication of the reversal from the current trend in the market. Following are the ways to Identify bullish and bearish Divergences in the market.
Bullish Divergence
When the price of the security is making lower lows and the PVT indicator is making higher lows, it is an occurrence of bullish divergence in the security. This indicates that the bearish trend is weakening and signals a potential bullish reversal in the price of the security.
The occurrence of bullish divergence doesn’t imply that security will move in the upward direction. One should only enter a long position in this strategy when the PVT indicator moves above the signal line.
The method of trading bullish divergence is similar to that of the bullish Signal Line Crossover Strategy.

Bearish Divergence
When the price of the security is making Higher Highs and the PVT indicator is making lower highs, it is an occurrence of bearish divergence in the security. This indicates that the bullish trend is weakening and signals a potential bearish reversal in the price of the security.
Similar to Bullish Divergence, the occurrence of bearish divergence doesn’t necessarily imply that the security will move in a downward direction. One should only consider entering a short position in this strategy when the PVT indicator moves below the signal line.
The method of trading bullish divergence is similar to that of the bearish Signal Line Crossover Strategy

Timeframe for PVT Indicator
The Price Volume Trend Indicator can be used on any timeframe depending on the trading style, goals, and duration of your trades.
However, it should be noted that one will get more signals on the shorter timeframes, but they are more vulnerable to the market noise. On the other hand, the longer timeframes may generate few signals but they may provide more significant trends.
In Closing
In this article, we discussed the meaning of the Price Volume Trend Indicator, the method to trade using this indicator and the timeframes in which one can use this indicator.
The Price Volume Trend (PVT) indicator is a useful tool, for traders to make informed decisions by analysing both price and volume. However, it is better to use this indicator with a combination of indicators like moving average which can help you get better convictions for your trade.
Written By Aaron Vas
By utilising the stock screener, stock heatmap, portfolio backtesting, and stock compare tool on the Trade Brains portal, investors gain access to comprehensive tools that enable them to identify the best stocks, also get updated with stock market news, and make well-informed investment.


