

What are Bollinger Bands Indicator: The stock market requires reliable knowledge, skills and tools to analyse the securities. Technical analysis, a study of price and volume data plays a major role to guide market participants in making potential decisions.

Apart from all the technical indicators, the Bollinger Bands indicator guides the market participants to gain knowledge on volatility, trends, reversals, breakouts and entry-exit signals to manage the risks involved in positions placed.
In this article, we shall learn about what are Bollinger bands indicator, and how to calculate Bollinger bands, and lets take a look at its best strategies below

What are Bollinger Bands?
Bollinger Bands, developed by John Bollinger in the 1980s, is a technical analysis tool defined by a set of three lines to generate overbought and oversold zones of the securities.
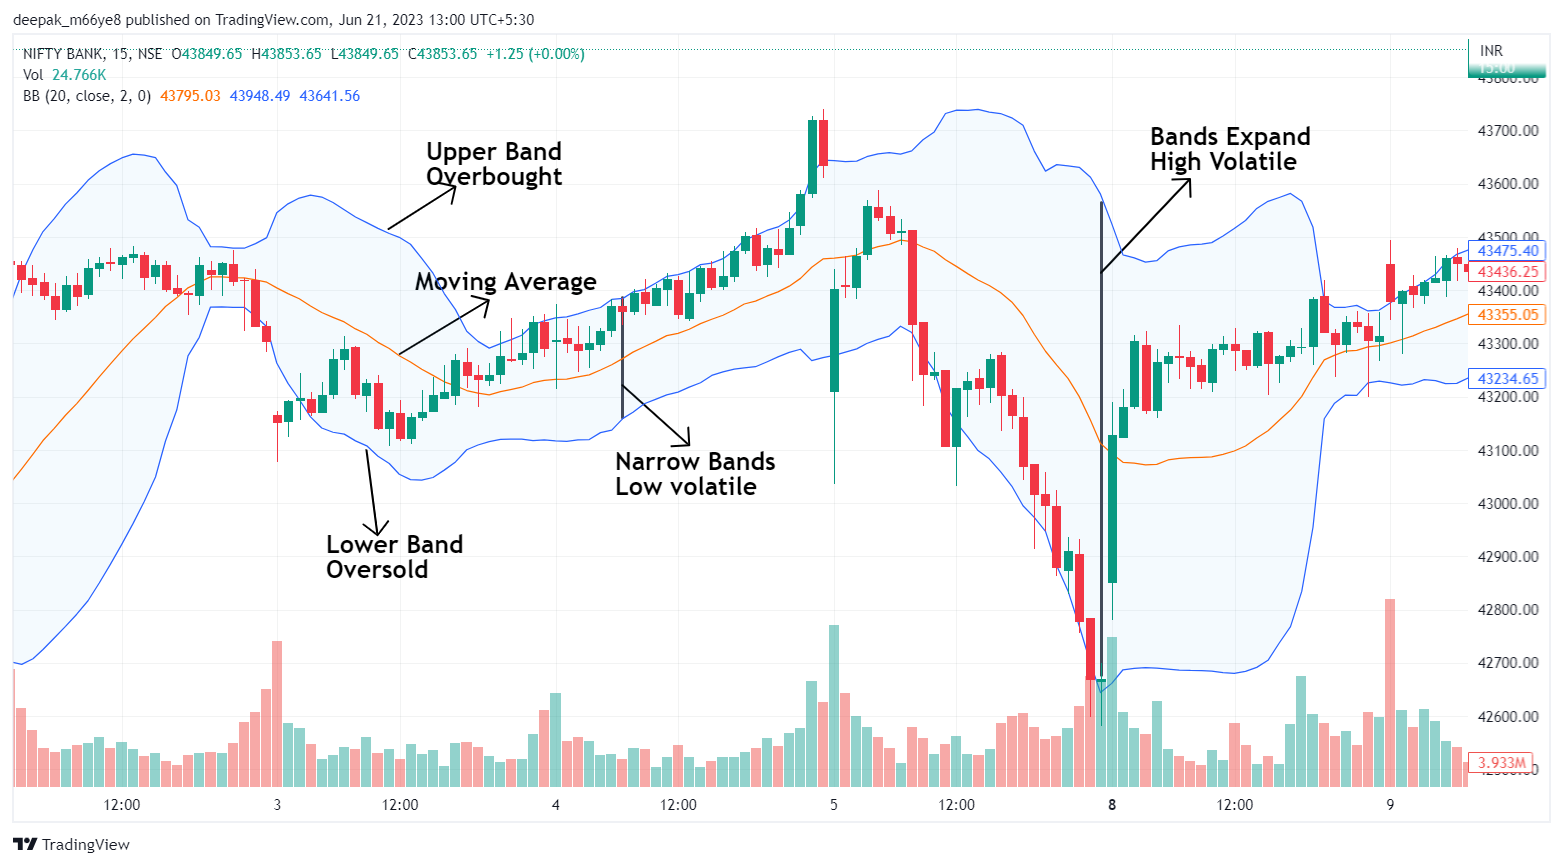
The three lines of the Bollinger Bands are, a simple moving average or middle band, upper band and lower band.

The Upper and lower bands comprise standard deviations from a 20-day simple moving average.
Bollinger Bands are placed over a price chart, it is also a volatility indicator which depicts quick trend reversals in the securities.
How to calculate Bollinger Bands?
The calculation part of Bollinger Bands indicator involves standard deviation and simple moving average.

Firstly calculate the Simple Moving Average(SMA) for a set of time periods(by default 20 days).
Now calculate the standard deviation for the same set of time periods multiplied by 2, and adding it to the Simple Moving Average(SMA) will generate an upper band. For the lower band subtract the standard deviation multiplied by 2, from Simple Moving Average(SMA).
Trading strategies with Bollinger Bands
The following are the strategies involved with Bollinger Bands to generate better trading opportunities.
Overbought and Oversold zone
Market participants generally use Bollinger Bands to identify overbought and oversold zones.
Overbought Zone
When the price of the security moves above the upper band it is considered as a overbought zone. A long position can be closed when the price of the security is above the upper band. Also, at the same point, a new entry for the short position can be spotted.
Oversold Zone
As the price of the security lowers below the lower band it is considered an oversold zone. Here, the short position placed can be closed. In the oversold zone, a fresh opportunity for entry into the long position can be spotted.

(Source: TradingView)
Volatility
To manage the risks in volatile markets, Bollinger Bands can be used as a volatility indicator to measure the volatility.
When the band contracts it signifies low volatility of the security, and when the bands expand, higher volatility can be understood.
(Source: TradingView)
Trends with Bollinger Bands
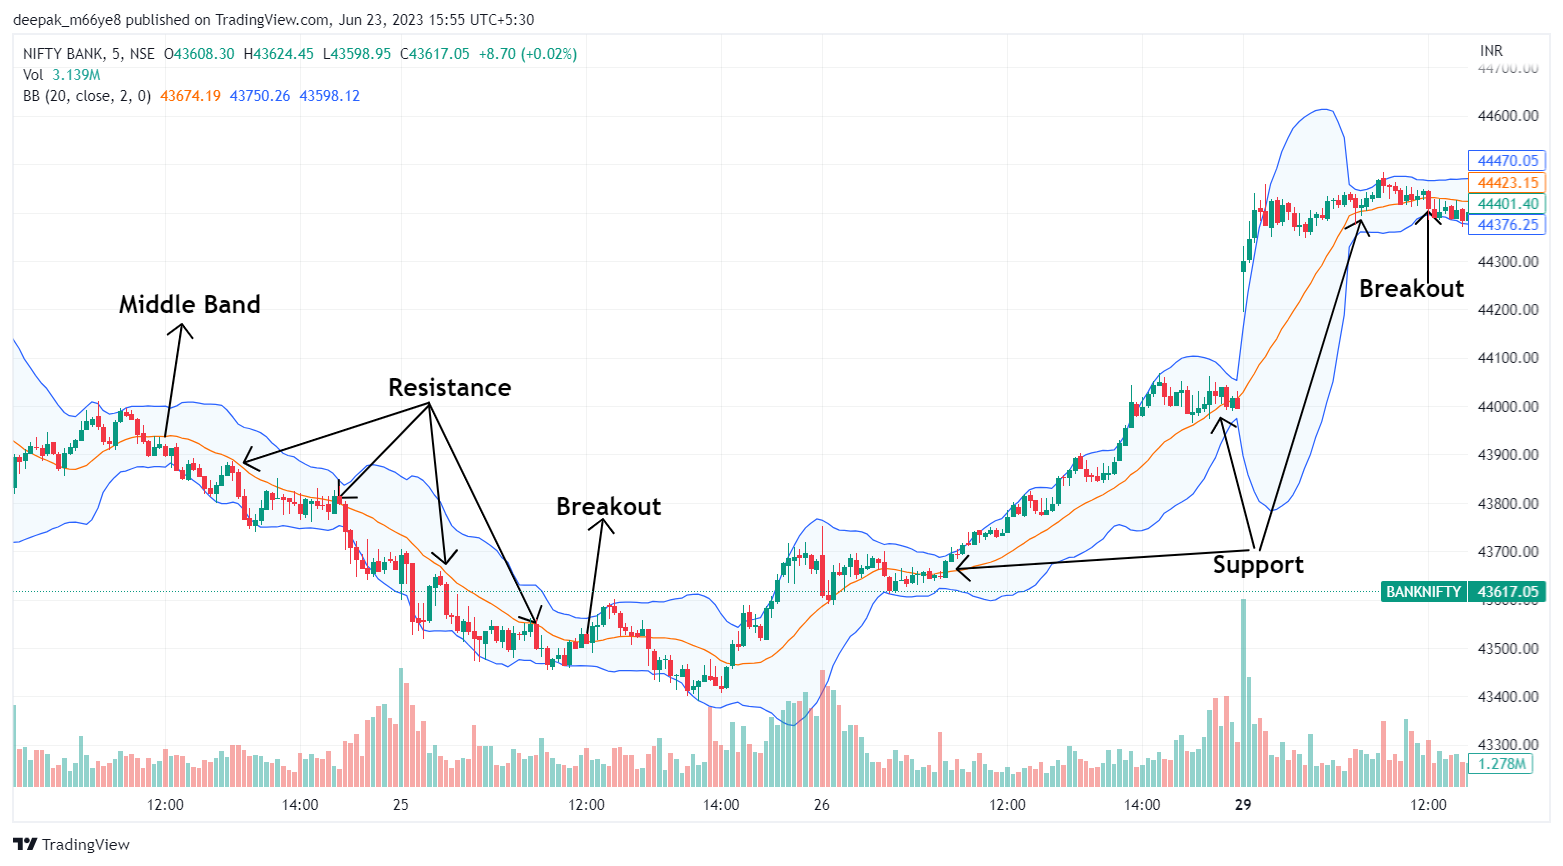
The middle band of Bollinger Bands is generated by moving averages which help traders identify trends in the securities.
For a downtrend, the price of the security crosses below the middle band, and the middle band acts as a resistance for the price as seen in the below image.
When the price of the security crosses above the middle band an uptrend is seen, for which the middle band acts as a support for the price of a security.
The middle band is used best, to trail the price of the security for a profit target.
(Source: TradingView)
Range-bound markets with Bollinger Bands
The Range bound markets trade between a specific high and low over a specific period. Generally, narrow range Bollinger Bands indicator is preferred over widened bands in range-bound markets to spot high and low prices of a security. When the price of a security is near to the lower band an entry to a new position can be placed or a short position can be squared off and vice versa.
Trading Bollinger Bands and Relative Strength Index(RSI)
To manage the risks involved in the position of the security it is important to use the indicator in conjunction with the other technical analysis.
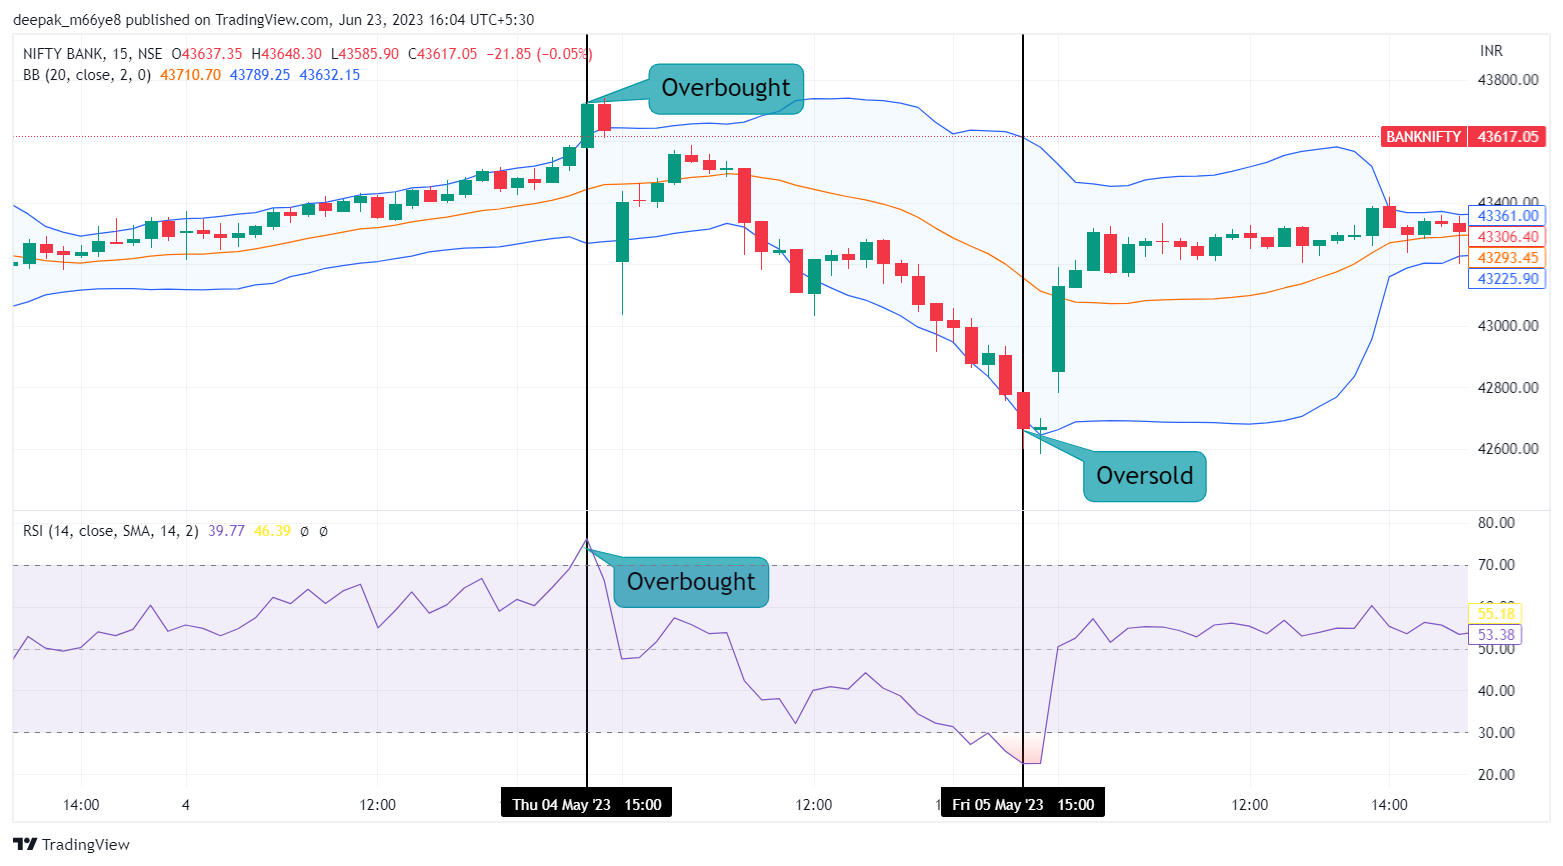
Here, we take Bollinger Bands and RSI as an example of strategy. The relative Strength Index(RSI) is a momentum indicator that measures the magnitude and speed of the price movement of securities.
We have learnt overbought and oversold zones with Bollinger Bands and Relative Strength Indicators.
When the price of the security nears the overbought zone in Bollinger Bands, wait for the RSI to oscillate over the overbought zone to confirm the entry/exit of the position to avoid false signals. For the security near the oversold zone in Bollinger Bands, to double-check the entry/exit of the positions, wait for the RSI to move over an oversold zone. Follow the below image for a better view.
(Source: TradingView)
Drawbacks
- The Bollinger Bands is one of the lagging indicators which doesn’t predict the trend of the securities.
- It just follows the recent price movements where the traders cant find the quick entry/exit signals of the security.
- Bollinger Bands generate false signals. For example, highly volatile markets widen the bands, which could result in false signals. In the low volatile markets, bands narrow and may result in reduced trading opportunities.
In Closing
Bollinger Bands are established as a reliable tool for technical analysis of the securities in the stock market for all the market participants. By utilizing the Bollinger Bands, one can have an accurate view of market volatility, trends, breakouts, support resistance and entry/exit opportunities.
However, It is advised to combine other technical analysis tools along with Bollinger Bands to have confirmed trades and to make potential decisions on market movements to manage the risks involved with increased confidence.
Written by Deepak M
By utilizing the stock screener, stock heatmap, portfolio backtesting, and stock compare tool on the Trade Brains portal, investors gain access to comprehensive tools that enable them to identify the best stocks also get updated with stock market news, and make well-informed investment decisions.


