

What are Triangle Chart Patterns: As a part of technical analysis tools chart patterns play an important role in understanding the price movement of the securities with better views.

Chart patterns are the lines drawn on price movements to help traders understand and identify potential breakouts, trend directions and price reversals to find entry or exit opportunities.
Under various chart patterns, Triangle Chart pattern Technical Analysis adds value to the chart patterns to analyse and predict price movements more confidently.

Here, we shall discover what are triangle chart patterns with types and how to identify entry and profit targets along with risk management.
What are Triangle Chart Patterns?
Triangle chart patterns are continuous chart patterns drawn by trendlines depicting the consolidation phase and breakout giving a clear uptrend or downtrend of a security. Similar to wedges and pennants, triangle patterns can either be a continuation pattern or a reversal pattern.

The upper trend line connecting the highs and the lower trend line connecting the lows of security converge at a point forming a triangle pattern. Traders identify the triangle chart pattern to enter a strong trend continuation or reversal after a consolidation phase of security to reach the profit targets.
Traders should confirm the triangle chart pattern with at least 4 touch points within the triangle formed for better trade opportunities.
Types of Triangle Chart Patterns
The three types of triangle chart patterns which help traders to identify the potential entry or exit points of security are:-

- Ascending triangle.
- Descending triangle.
- Symmetrical triangle.
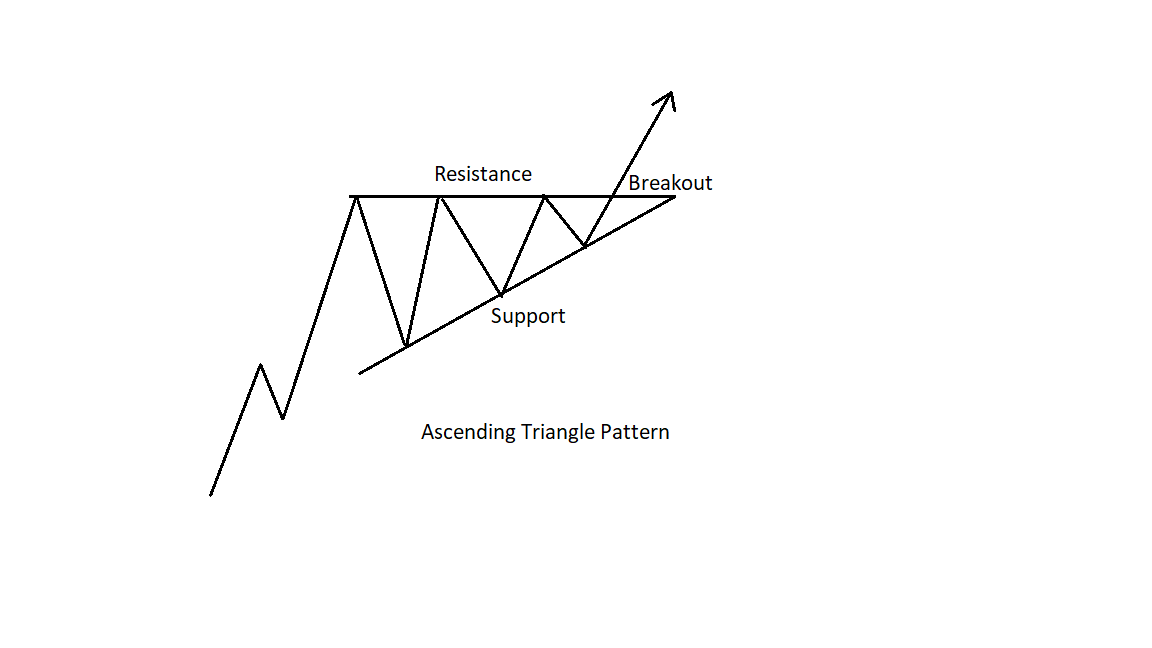
Ascending Triangle Pattern
Ascending Triangle is a continuous pattern, which means that the prior bull trend is expected to continue after ascending triangle breakout.
It is a type of triangle chart pattern formed by joining the identical highs of a security with a horizontal line which acts as a resistance and the higher lows of a security with a trend line which acts as a support. when these two lines converge at a point forming an ascending triangle chart pattern interprets a bullish trend over a price breakout.
The fundamental aspect of the raising pattern is to show that sellers are less successful to pull the prices lower hence the price overcomes the resistance level and triggers more buying to form a strong uptrend.
Trading with Ascending Triangle chart pattern.
Entry:- If the price of a security breaks and close above the resistance level of the pattern, traders can enter a long position to capture a bullish trend in the security.
Stop loss:- Traders can set the resistance level as a trigger point for a stop loss and should exit the trade a few points below the resistance line as good risk management.
Profit Target:- The profit target is the distance between the lowest price point to the resistance line of the pattern formed. When the price reaches the distance calculated, traders can book a profit or trail their stop loss for more profit targets.

Ascending Triangle pattern in Bank nifty chart.
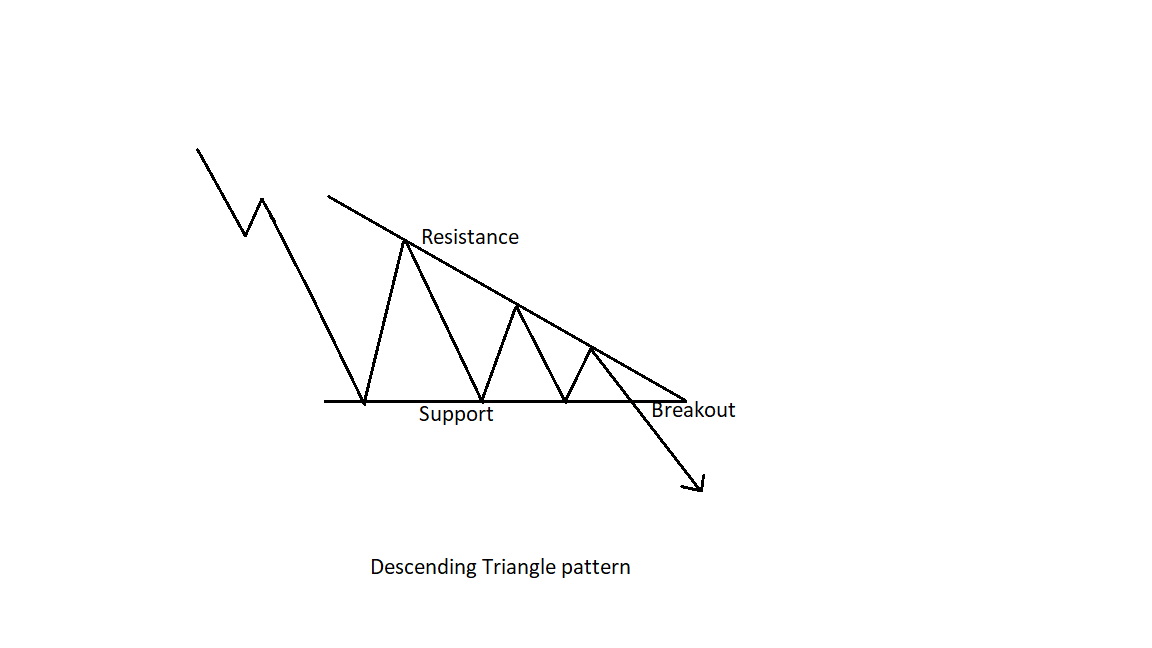
Descending Triangle pattern
It is a type of triangle chart pattern which is the slight opposite of ascending triangle pattern which we have reviewed.
Descending triangle pattern is a continuation pattern of the prior downtrend when the price of security breaks, and it is formed by joining the lower highs of security with descending trendline which acts as a resistance and joining the lows of security with a horizontal support line.
When the prices try to fall more it is supported by the support level and as it bounces back the resistance control to make highs.
Failure of each attempt finally leads the sellers to take control and drive the prices below the support line of the pattern, confirming a strong downtrend in the security.
Trading with Descending Triangle Chart Pattern
Entry:- When the price of the security breaks and close below the support line of the pattern, traders can enter a short position in the security to capture the potential downtrend.
Profit Target:- The profit target is calculated as the distance between the highest price point to the support line of the pattern formed. When the price of the security reaches the distance calculated traders can book the profits or trail the stop loss for further profit targets.
Stop loss:- Traders can set the support level of the pattern as a trigger point for stop loss and should exit the trade a few points below the support line as good risk management.

Chart of Bank Nifty showing Descending triangle pattern.
Symmetrical Triangle Pattern
A symmetrical pattern occurs when price moves are creating lower highs and higher lows. Connecting the highs and lows with a trendline meeting towards each other forms a symmetrical triangle, and the upper trend line and lower trend line acts as a resistance and support line respectively.
Symmetrical triangle patterns are generally seen as consolidation patterns and a minimum of two highs and two lows are preferred to form a potential pattern for a trend-directional breakout.
The symmetrical triangle pattern often indicates a trend direction or reversal breakout, we shall discuss the application of a symmetrical triangle pattern in uptrend and downtrend cases separately.
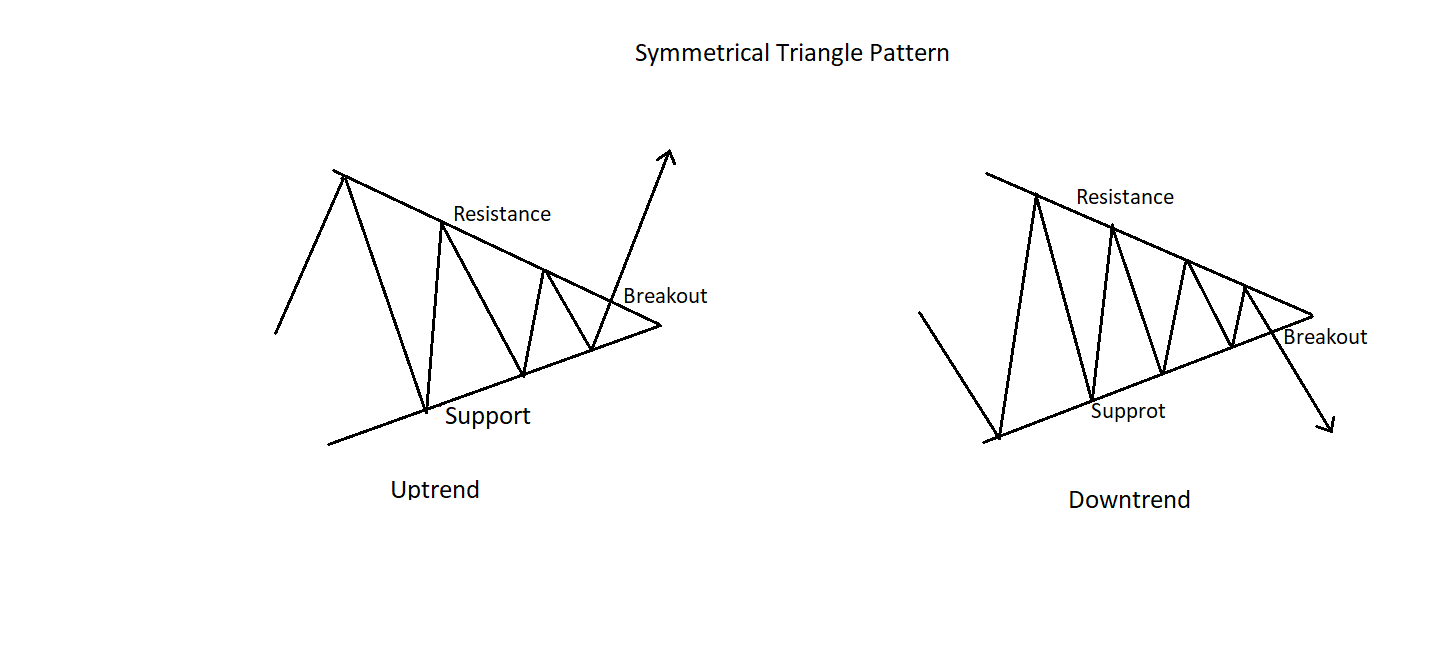
Symmetrical Triangle uptrend
If the price of a security breaks and close above the resistance line of the symmetrical triangle pattern formed, the bullish uptrend of the security is confirmed.
Entry:- When the price of the security close above the upper trend line, traders can enter a long position in the security.
Profit Target:- When the price reaches the length of the base of a triangle formed, a profit target is booked. Traders can trail the stop loss higher for further profit targets.
Stop loss:- The resistance line of the pattern is set as a trigger stop loss and if the price of the security moves below the upper trend line one should exit the trade.
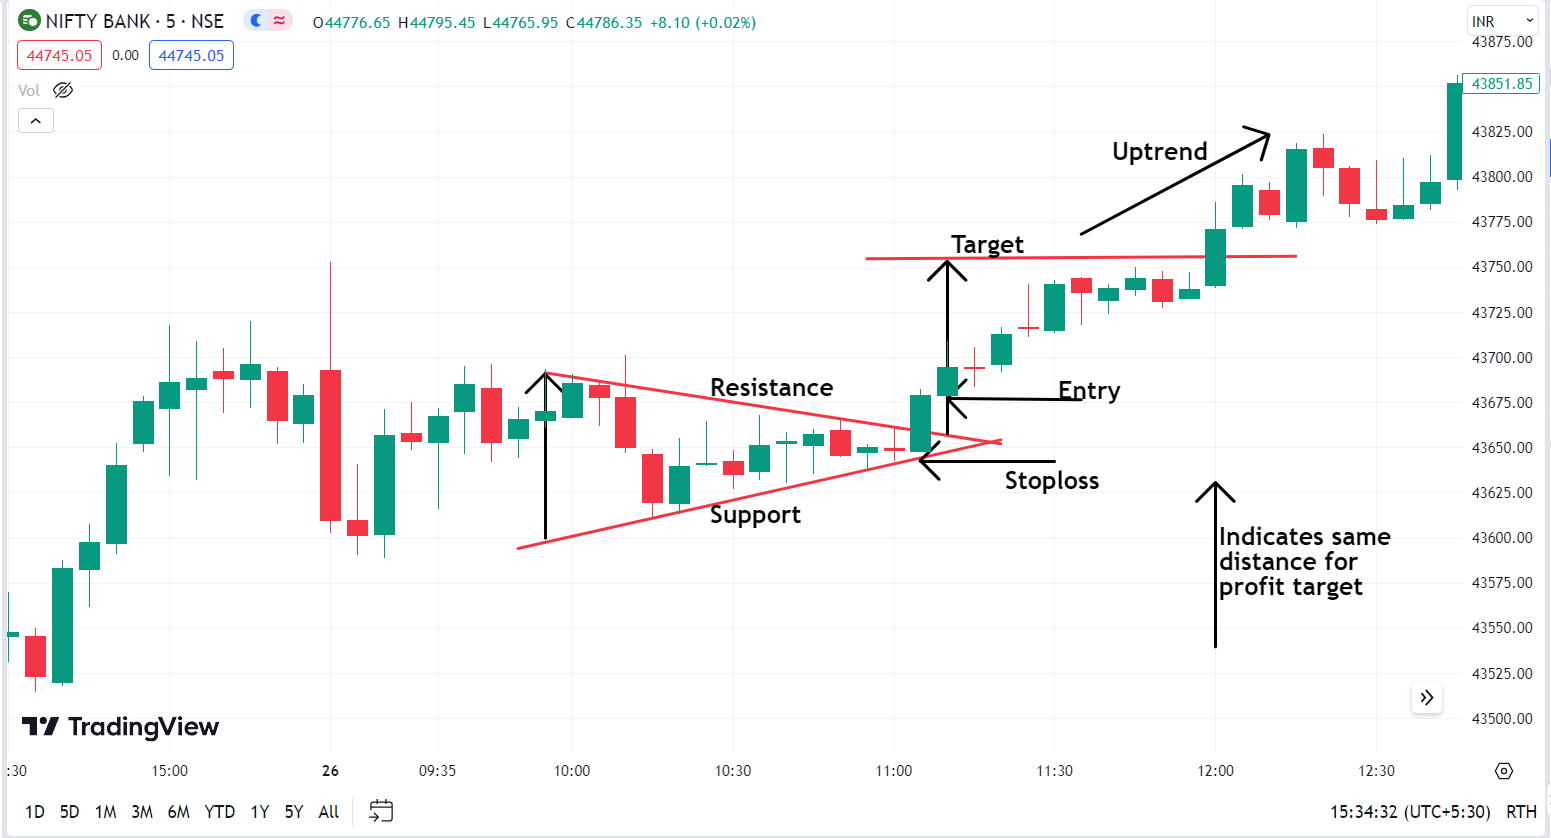
Chart of Bank NIfty showing Symmetrical triangle pattern.
Symmetrical Triangle Downtrend
If the price of the security breaks and close below the support line of the symmetrical triangle pattern formed, the bearish trend of the security is confirmed.
Entry:- When the price of the security close below the lower trend line, traders can enter a short position to capture the bearish trend.
Profit Target:- When the price reaches the length of the base of a triangle formed, a profit target is booked. Traders can trail the stop loss to reach further profit targets.
Stop loss:- The support line of the pattern formed is set as a trigger stop loss and if the price of the security moves above the support line one should exit the trade to cut further losses.
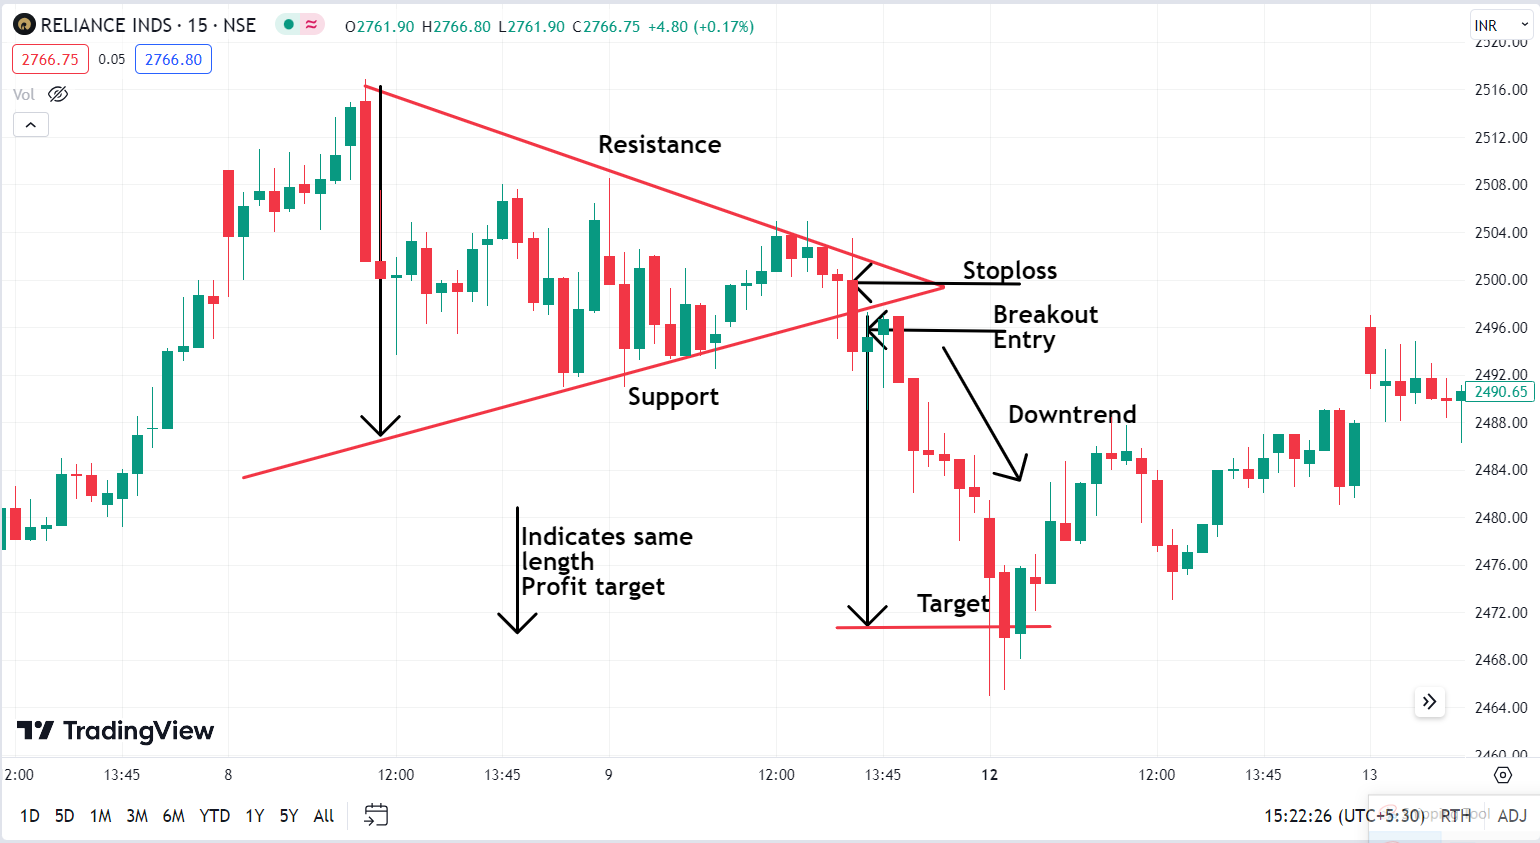
Chart of Reliance Industries showing Symmetrical triangle pattern.
In Closing
Triangle Chart Pattern Technical analysis is important for the market participants to find potential trades by identifying valid patterns and breakouts in securities. Traders use a triangle pattern to trade in continuation of the prior trend after the consolidation phase.
As per the market experts, in most cases, the breakout is convincing to the previous trend direction but in some cases, the breakout can also register a price trend reversal, ease of identifying breakout and reversal comes out with one’s experience.
The Triangle chart pattern technical analysis helps traders identify potential trades with better views to make a profitable trade with good risk-reward ratios.
Written by Deepak M
By utilizing the stock screener, stock heatmap, portfolio backtesting, and stock compare tool on the Trade Brains portal, investors gain access to comprehensive tools that enable them to identify the best stocks also get updated with stock market news, and make well-informed investment decisions.


