
What is an Option Chain: Options are the highest traded derivative instrument in the world. It is such a lucrative and versatile product that even investors like Warren Buffet use it to hedge their existing position and better that entry price (by writing options and pocketing the premium).
But is it enough to just know about the Call (buy to express a bullish view) and Put (Sell to express a bearish view) option to make a trade decision or do we need to understand the other various technicalities associated with them and make an informed trade decision based on that.
In reality, the prices/premium which is being charged for any particular option is an amalgamation of various factors and information regarding the same can easily be accessed from the Options chain.
Over the course of our discussion in this chapter, we will understand in detail what an Option chain is and how one goes about analysing it.
What is an Option Chain?
Before understanding Option Chain, it is important to understand what Chain means. To put it in simple words, the chain is the tying of knots and similarly, the various aspects of options trading are the various knots and putting them together to make sense is the function of the Option chain.
An option chain is a log or table which provides information about various aspects of an Option for a particular underlying asset. It provides details about all the active options contracts for the particular security. It shows prices for various Calls and Put options for all the expiry.
The Option chain also provides information about Open Interest and Change in Open Interest (for both Call and Put Option), Volume, IV (Implied Volatility), changes in prices, bid quantity, ask quantity etc. This information is available for both Call and Put Options.
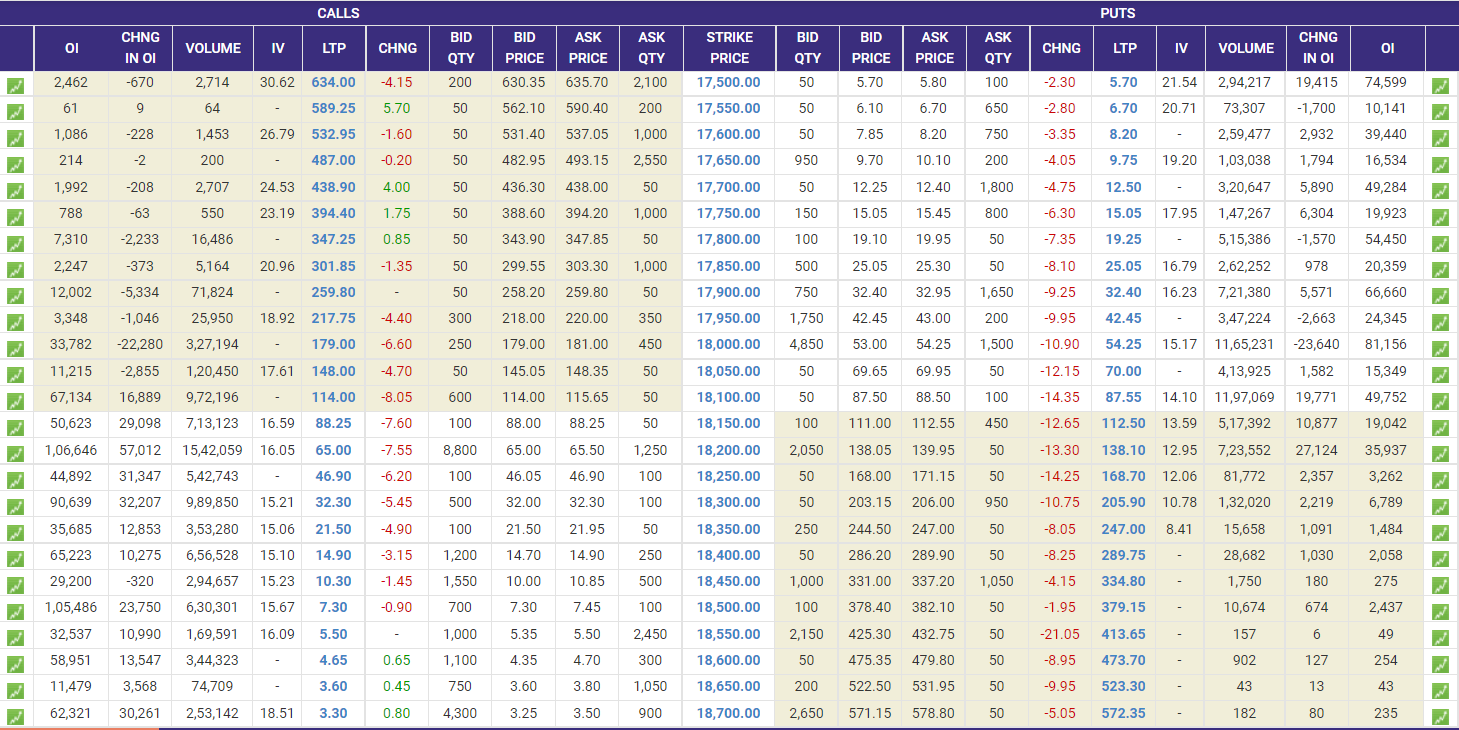
(Image: Options Chain for Nifty, source: www.nseindia.com)
The image above is the Option chain for Nifty and the spot price of Nifty is 18108 and the contract is due to expire in three days. And we will try and understand each and every component of the Option Chain-
(Note: The Following Discussion is Based on the Option Chain shown above)
QUICK READ – Option Trading Strategies For Beginners
Placement of Data
In the image above, both call and put option data are highlighted on the screen. The data for the Call Option is put on the left-hand side and the data for the Put Option are put on the right side of the screen.
On the Call option side, the strike prices below the At the Money Contract (18100 ce) are Out of Money and all the data above the Money contract are At the Money strike price. Similarly, for the Put option side, the data above the At the Money contract is Out of Money and the strike prices below the At the Money strike prices are In the Money contracts.
Open Interest (OI)
Open Interest is the total number of contracts outstanding. Higher the number of contracts outstanding, the more the interest for that particular strike price. We need to understand that each and every contract in this option chain has its own mechanism and can be traded like an individual by-product.
If a trader buys a 10 Call option contract of a particular price then the OI will go up by 10 and eventually when he squares off or sells those contracts, then the Open Interest goes down by 10 units.
The Volume activity is the least as we go deep In the Money (ITM) or Out of Money (OTM) for both call and Put Options. And as we draw closer towards the At the Money (ATM), the volume activity is the highest for both call and Put options.
Volume
Volume is the number of contracts that have traded for that particular strike price. Just like Open Interest, the volume traded is the highest for contracts that are near At the Money Strike price and least for strike prices that are far away from At the Money contracts.
Implied Volatility (IV)
According to Investopedia, “The term implied volatility refers to a metric that captures the market’s view of the likelihood of changes in a given security’s price. Investors can use implied volatility to project future moves and supply and demand, and often employ it to price options contracts.”
To put it in simple words, implied volatility tells you, what is the expected volatility in the price of a security over the next one month. The value of implied volatility in the Option chain is always in terms of percentage. In the image above, for the 18150 strike price, the IV for the Call option is 16.59 and the IV for a Put option is 13.59, and these are the expected movement in the prices of those Options.
Last Traded Price
This is the last price that has traded for that particular strike price. If the traded price is above the previous day close then the momentum can be said the bullish (Call option prices going up) or Bearish (Put option prices going up)
Bid Ask Spread
The Bid ask spread is the difference between the best price asked and the best price offered for the particular strike price. In the image above, for the 17500 Call Option, the bid price is 630.35 and the best offer for sell is 635.70. So the spread would be 5.35.
As we go deep In the money or Out of money, the bid ask spread increases as there are less interested parties in these contracts and as we come to strike price closer to the At the money contracts, the spread shrinks and becomes tighter.
Put Call Ratio
Put Call Ratio (PCR) is a tool that is used by traders to gauge and understand the overall sentiment of the market. Bearish views in the market can be expressed by buying a “Put” option and Bullish views can be expressed by buying a “Call” option.
So, if we see more Puts being bought in the market than Calls, then it can be assumed that the sentiment in the market is bearish and vice versa if we see more Calls being bought than Puts in the market. You can visit here to know more about What is Put Call Ratio?
ALSO READ
To Conclude
The Option chain is the holy grail for options traders. A complete understanding of the option chain always betters the chances of picking the right trade and the right point of entry. Just to put things into perspective, an analysis of the Open Interest and Put Call ratio tells us about the prevalent sentiment and expected movement in the prices of the underlying asset.
Happy Trading and Money Making !!

Hitesh Singhi is an active derivative trader with over +10 years of experience of trading in Futures and Options in Indian Equity market and International energy products like Brent Crude, WTI Crude, RBOB, Gasoline etc. He has traded on BSE, NSE, ICE Exchange & NYMEX Exchange. By qualification, Hitesh has a graduate degree in Business Management and an MBA in Finance. Connect with Hitesh over Twitter here!
