

What is Evening Star Pattern: Candlestick patterns are part of technical analysis used by traders to read the price movement of securities more accurately. Bullish and bearish candlestick patterns help traders to spot trend reversals and identify potential entry or exit opportunities in the price of a security.

The evening star candlestick pattern is a bearish pattern used to identify the price reversal from uptrend to downtrend with a well-defined entry, stop loss and target with good risk management.
In this article, we shall learn what is evening star pattern, the pattern formation and the strategies involved to trade with a better understanding of price action.

What is Evening Star Pattern?
The Evening star pattern is a type of bearish candlestick pattern used by traders to analyse the price movement of securities. A prior uptrend followed by Evening Star Pattern indicates a trend reversal towards a downtrend.
The Evening Star Pattern is a technical analysis tool consisting of 3 candles, a large green candle, a small-bodied candle(Doji) and a red candle.

The pattern formed at the top of an uptrend signifies that the uptrend is about to end, traders use this pattern to either exit an uptrend or enter a downtrend. It is the opposite of the Morning Star Pattern, which is a bullish candlestick pattern.
Formation of Evening Star Pattern
The Evening Star Pattern is formed by a combination of three candles with a strong prior uptrend.
The three candles are:-

- Long Green candle
- Small-bodied candle(Evening Doji)
- Long Red candle
- Green candle:- A strong green candle is formed on top of an uptrend indicating strong buying with bulls in control.
- Small-bodied candle(Evening Doji):- Firstly, Doji is a type of candle with a green or red body formed when the market opens and closes at the same level or almost the same level indicating indecision of price movement with buyers and sellers. It is also referred to as Evening Doji when a doji is formed in Evening Star Pattern. The Evening Doji formed after a green candle indicates uncertainty in the trend and the prior uptrend formed can reverse towards the downtrend.
- Red Candle:- After the Evening Doji candle is formed, as a confirmation of the trend reversal, a long red candle is formed, indicating more selling pressure towards the downtrend.

Formation of Evening Star candlestick Pattern
Strategies to trade with Evening Star Pattern
Once the Evening Star Pattern is formed, traders can find entry/exit opportunities with a better view of trends.
Entry, Stop loss and Target.
Evening Star Pattern gives a good opportunity to spot trend reversal and trading signals.
Entry:- When the price of security forms the Evening Star Pattern, traders can enter security after the close of the long bearish candle to ride the downtrend.
Stop loss:- The stop loss for a trade with the evening star pattern will be the high of the evening doji candle formed in security.
Target:- Targets are based on better risk-reward ratios. Here, the risk is from entry to stop loss and the reward is from entry to target. If the risk is 1 part, the reward can be 2 part or 3 part which is 1:2 or 1:3.
Also, traders can trail the stop loss to achieve higher targets in security.

Here is an example of HDFC Bank, an evening star candlestick pattern formed with a prior uptrend, the Entry and Stop loss are defined as discussed above. The target can be set based on risk-reward ratios of 1:2 or 1:3.
Relative Strength Index(RSI) with the Evening Star Pattern
RSI is a technical indicator which oscillates between 0 to 100 indicating overbought and oversold levels.
When the RSI indicator oscillates above the 70 level, it is considered that the price of a security is trading in an overbought zone and a downward price movement is to be expected.
When the RSI indicator is oscillating below 30 levels then it is understood that the price of the security is trading in an oversold zone and an upward price movement is to be expected.
Using the overbought and oversold zones depicted by the RSI indicator, we shall discuss how to find confirmation of entry/exit opportunities of the evening star pattern formed on the chart
We know that entry in the evening star pattern is after the close of a long red candle. Upon confirmation of the entry, if the RSI indicator oscillates to the overbought zone, then the overbought zone of the RSI indicator confirms the downtrend along with the evening star pattern.
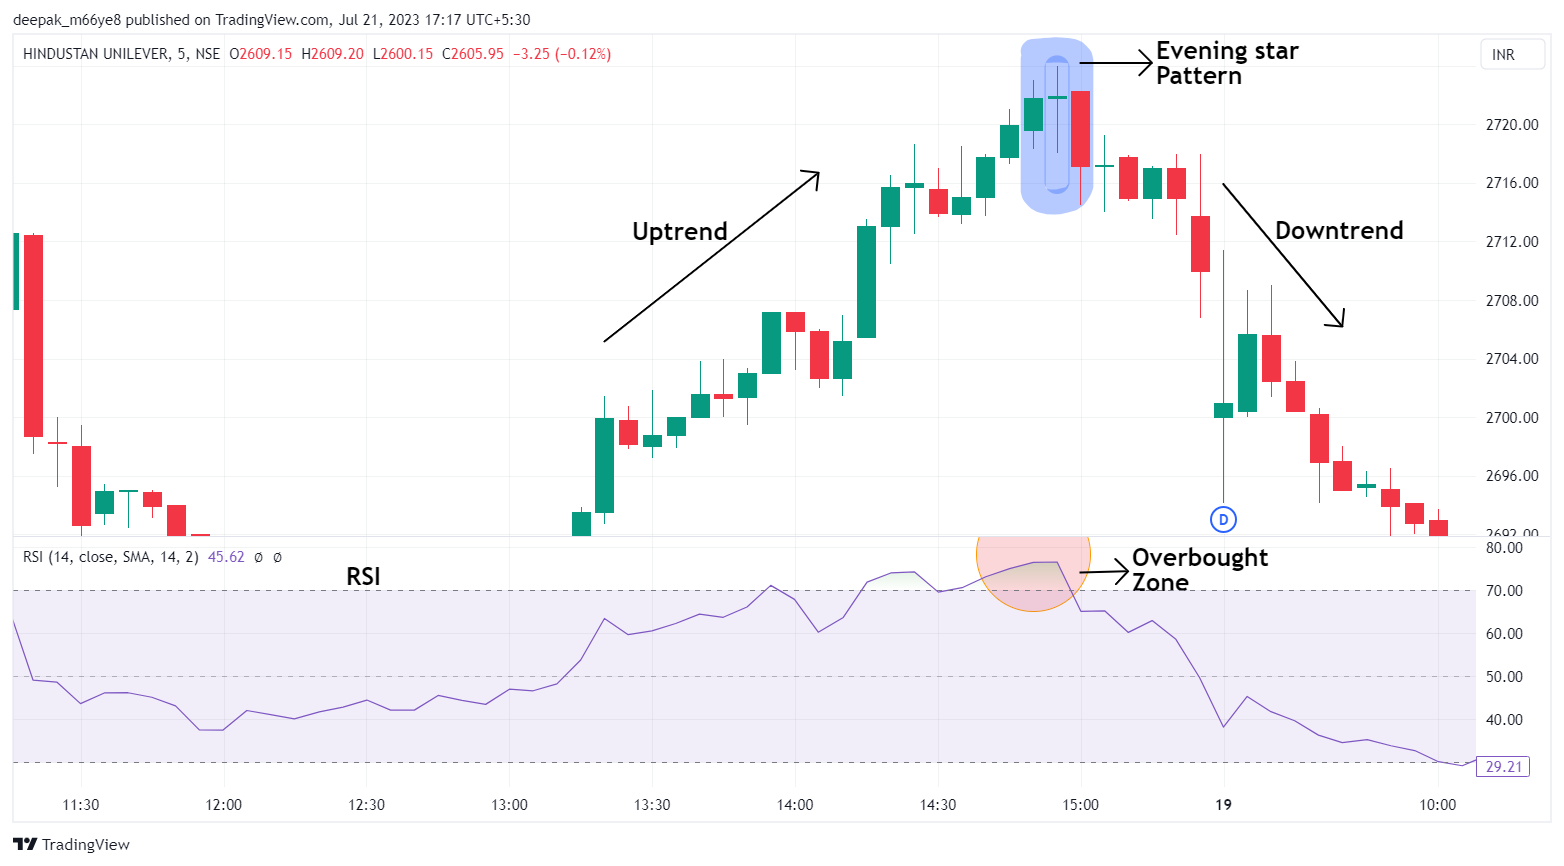
Chart of Hindustan Unilever showing evening star pattern in confirmation with RSI indicator.
Pros and cons of Evening Star Pattern
The bearish evening star pattern has both pros and cons.
Pros:-
- Evening Star candlestick pattern is frequently identified on charts.
- The entry and targets are well-defined with the pattern.
- Stop loss levels of the pattern gives good risk-reward ratios.
Cons:-
- The false signal of a reversal in the pattern could end up making prices move higher resulting in the failure of trade.
- Sometimes a tight stop loss in the pattern can be triggered too often.
- The evening star candlestick pattern is preferred with other technical tools for a better and confirmed view.
In Closing
The evening star pattern is a reliable bearish candlestick pattern implemented by traders for potential views on entry/exit opportunities of the security.
With the above-discussed concepts and strategies, traders can build a profitable setup with the bearish evening star candlestick pattern to identify the trend reversal and gain the most from the downtrend trade.
As a part of the technical analysis, it is always preferred to use other technical analysis tools like indicators, chart patterns, price volume analysis and candlestick patterns in conjunction with the evening star candlestick pattern to avoid false signals and to have a valid confirmation of the entry with good risk management and rewards.
Written by Deepak M
By utilizing the stock screener, stock heatmap, portfolio backtesting, and stock compare tool on the Trade Brains portal, investors gain access to comprehensive tools that enable them to identify the best stocks also get updated with stock market news, and make well-informed investment decisions.


