

Understanding what is head and shoulders Pattern: Every new or experienced trader has come across this charting pattern called the “Head and Shoulders” pattern. So, what makes this pattern so popular amongst traders and investors, and why are analysts always on the lookout for the formation of this pattern on the chart?

The simple answer to this question is the kind of trading opportunities that follow post the formation of this pattern. This pattern has the potential of generating long term trends in the market (bullish or bearish) and the rewards are also substantially big.
What is Head and Shoulders Pattern?
The first visual appearance of this pattern gives you the feel of staring at three peaks standing next to each other. The middle peak is taller as compared to the peaks on either side. All three peaks have a common baseline.

While using technical analysis for trading, Head and shoulders patterns aim to predict Bullish or Bearish trend reversals in the market. The Head and Shoulders formation is said to be one of the most reliable forms of technical indicators used by traders.
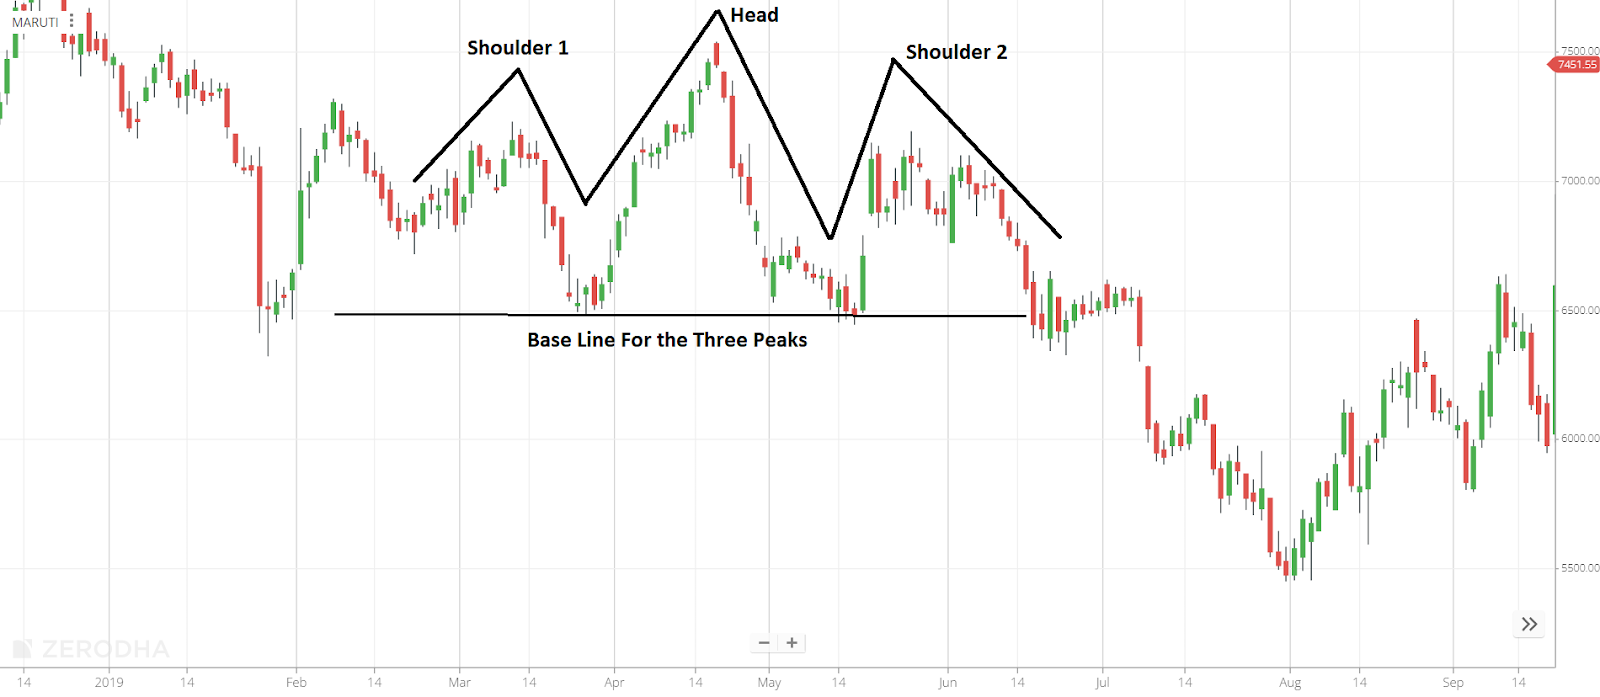
(image source: www.zerodha.com)

The image above is the daily chart of Maruti and we see a classic case of Head and shoulders formation and post which we see bearish momentum in the market. The share prices have been constantly finding support near the 6500 levels and which acted as baseline for the three peak formation.
The high of shoulder 1 is around 7200 levels. The high of the head is near the 7550 levels and again the high of shoulder 2 is near 7200 levels. And once the market broke the base line support after the formation of head and shoulders pattern, we saw a steep fall in the share prices (nearly 15%)
ALSO READ

How Does One Take a Trade Using the Head and Shoulders?
Taking trades using the Head and Shoulders pattern is a game of patience. The trade becomes active only after the completion of the formation.
- A head and shoulders pattern is completed only after the market starts trading below the baseline after the formation of the 2nd shoulder.
- The Stop loss for the trade is above the high of the 2nd shoulder.
- The target for the trade is the distance between the baseline and the head
- So, the risk to reward is always more than 1:1. The larger the distance between the head and shoulder, the better the risk to reward ratio for the trade.
- The holding period for trade using the head and shoulders is longer as the targets for these kinds of trades are big.
So, in the example of Maruti (image above)-
- Entry point for shorts = 6450
- Stop loss = above 7200 levels
- Distance between Head and the Baseline = 7550 – 6500
= 1050
- So, the target of the downside for the short trade would be = 6500 – 1050
= 5450
And the low on the chart for the shares of Maruti on the chart is = Rs. 5455
What is Inverse Head and Shoulders?
If you are looking for long term buy opportunities, then the inverse head and shoulders is one pattern you would not want to miss out on. The chart setup and pattern formation is exactly opposite to that of the Head and shoulders pattern discussed above.

(Image 2 Source: www.zerodha.com)
The image above shows the inverse Head and Shoulders pattern on the charts of Infosys. And once the formation of the pattern is complete, we see bullish momentum coming in the market. The top line on the chart above is the point of inflection.
The target for the longs initiated using this pattern is the distance between the Inverse head and the top line and the stop loss would be the difference between Inverse shoulder 2 and the top line.
Advantages and Limitations of Head and Shoulders Pattern
| Advantages | Limitations |
| Very easy to identify this pattern if you are an experienced trader | Pattern identification is difficult if you are new to the field of trading |
| The risk and rewards can be defined at the time of entering the trade | Sometimes the risk to reward is not favourable if the trade entry point is far away from the top line or baseline |
| Potentially the rewards can be very big | The traders need to be patient as the trade can sometimes take to materialise |
To Conclude…
The head and shoulder pattern has the potential of generating substantial reward for both longs and shorts taken in the market. The key here is to spot them at the right time. And as these trades take time to materialize, one needs to be patient and disciplined while executing these trades.
And most importantly no trade patterns ever provides results with 100% accuracy. One needs to use his judgement and the feel for the market to be able to successfully execute the trade.
Happy Trading and Money Making!!


