

What is Super Trend Indicator : Market participants use different tools to analyse the stock market in their own niche to get profited from it to the maximum. Under the various technical tools present, here we have an important technical analysis tool called the Super trend indicator.

The super trend indicator is preferred by traders to analyse the trends, price reversals, and support or resistance levels to identify better entry or exit opportunities.
We shall discuss what is super trend indicator, the calculations involved and how to build strategies with the indicator to find trades with good risk-reward ratios.

What is super trend indicator?
The super trend indicator developed by Olivier Seban is a trend-following indicator represented on a price chart which indicates the price movement direction to identify the overall trend of the markets.
The indicator turns red when the security is in bearish momentum, and when the indicator turns green when the security tends to be in bullish momentum.

Supertrend indicator basically works on two parameters, periods and multiplier.
Periods:- It is a value of ATR. The default setting of 10 periods for ATR is used.
Multiplier:- It is a value by which ATR is multiplied. 3 is a multiplier by default.

Average True Range(ATR)
The average True Range(ATR) is a market volatility indicator that measures the average range of price movement over a specific period of time. ATR is originally derived from the simple moving average.
Super Trend Indicator Formula
The super trend indicator is calculated as:-
Uptrend= (high + low) / 2 + multiplier x ATR
Downtrend = (high + low) / 2 – multiplier x ATR
ATR(Average True Range) is calculated as:-
[(Prior ATR x 13) + current TR]/14
Here, 14 is the default period set.
TR= True Range.
Hence, ATR plays a major role in forming the super trend indicator.
Super Trend Indicator Trading Strategies
1. Buy and Sell signals using Super Trend indicator
The super trend indicator helps traders to identify bullish or bearish trends in the market by appearing above or below the price of a security and changing colour to red or green.
The indicator gives us a buy signal when the super trend moves below the closing price of a security and changes its colour to green.
When the supertrend indicator moves above the closing price of a security it indicates a sell signal by changing its colour to red.

(Source: TradingView)
Chart of HDFC Bank showing Buy and Sell signals with the super trend indicator.
2. Support and Resistance with Super Trend Indicator
Super trend indicator also offers strong support and resistance for security to identify enter or exit trades. It also signals a stop loss to the trades.
When the buy signal is active the indicator changes to green and one can enter a long position in the security, the super trend here acts as a support to the bullish trend and the security can be trailed further upwards based on the indicator movement.
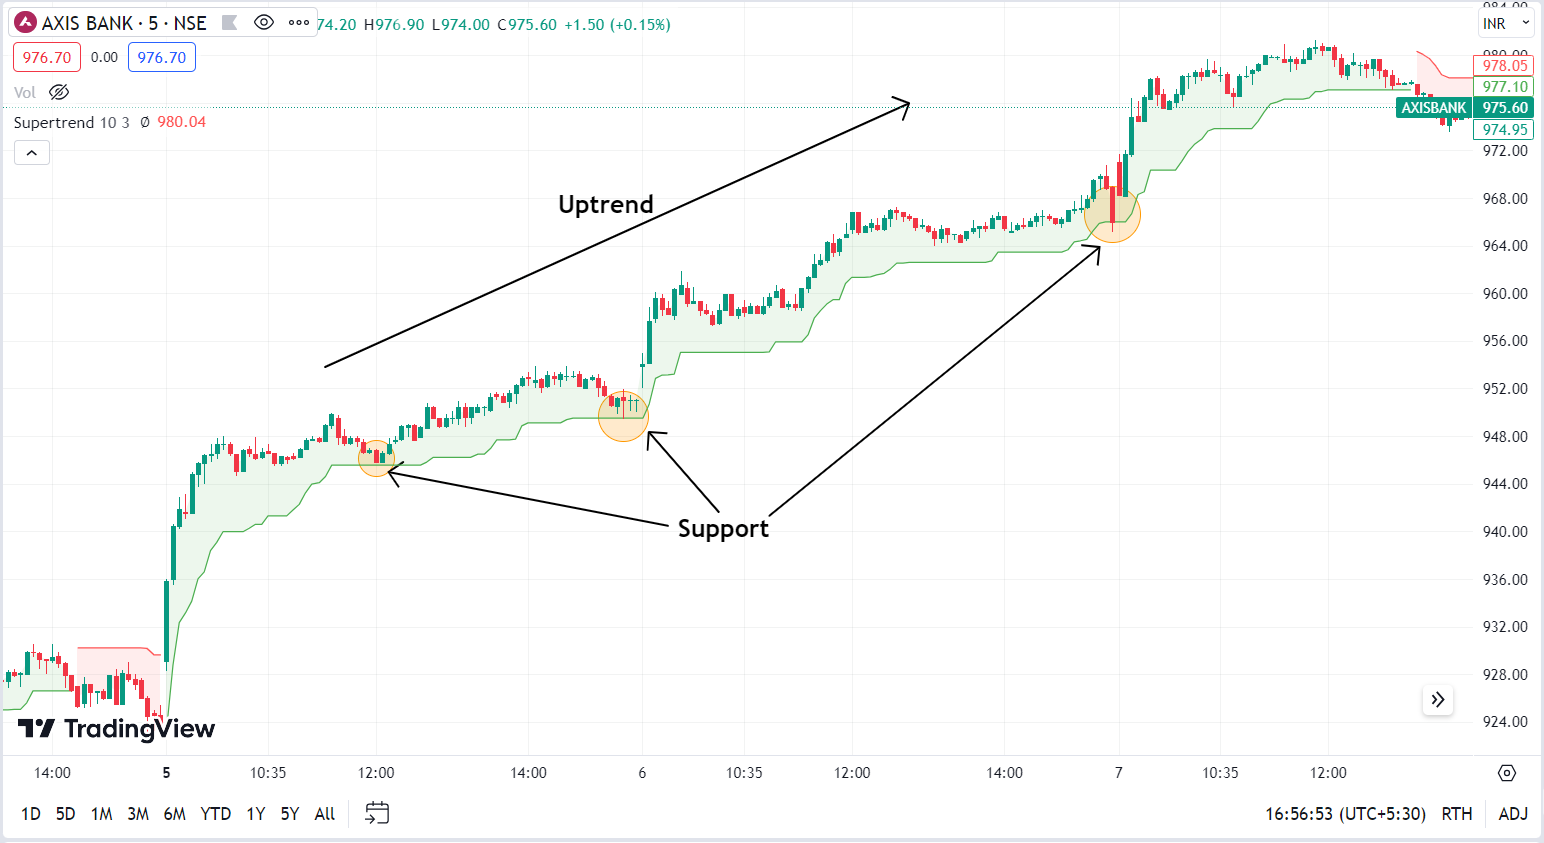
(Source: TradingView)
Chart of Axis Bank showing support acted by a super trend indicator.
When the security is in a downtrend the indicator moves above the price and changes its colour to red. Here, one can enter a short position and the indicator acts as a resistance to the price movement.
The traders can trail the security further downside by taking resistance as a reference line to reach their preferred targets.
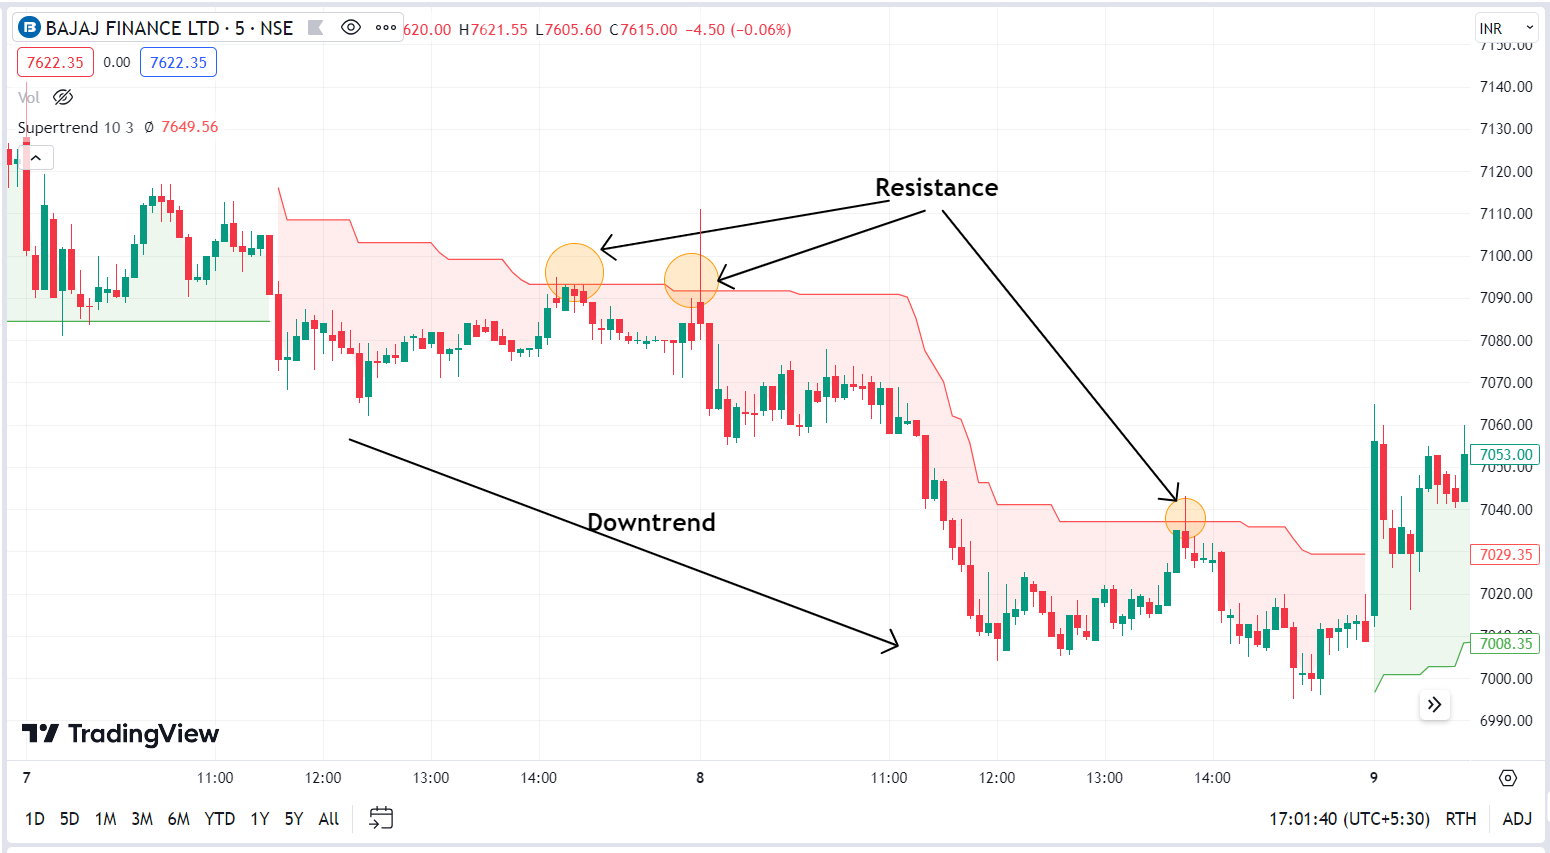
(Source: TradingView)
Chart of Bajaj Finance LTD showing Resistance acted by a super trend indicator.
To manage the risks involved in the positions stop loss plays a key role, so the super trend indicator helps traders to place stop loss.
If a long position is placed, the stop loss can be placed below the green line of an indicator. It indicates to exit the long position if the price of a security closes below the green line of a super trend indicator.
In the bearish trend, the indicator changes to red and one can place a short position, the stop loss for the positing is placed above the red line. It indicates to exit the trade if the closing price of the security moves above the red line of a super trend indicator.
3. Super Trend Indicator and Moving average crossover
This strategy is simple to use and identifies trades with a double confirmation to capture bigger trends with minimised risks.
Here, we shall consider 5 EMA and 20 EMA with the super trend indicator as an example.
When the super trend indicator turns green it generates a buy signal to go long, as a confirmation to the indicator if the 5 EMA line crosses above the 20 EMA line then entry to the long position is placed.
In the downside trend, the indicator turns red in colour generating a sell signal, as a confirmation to the indicator if the 5 EMA line crosses below the 20 EMA line, and then a trader can short a position to capture the downtrend market.
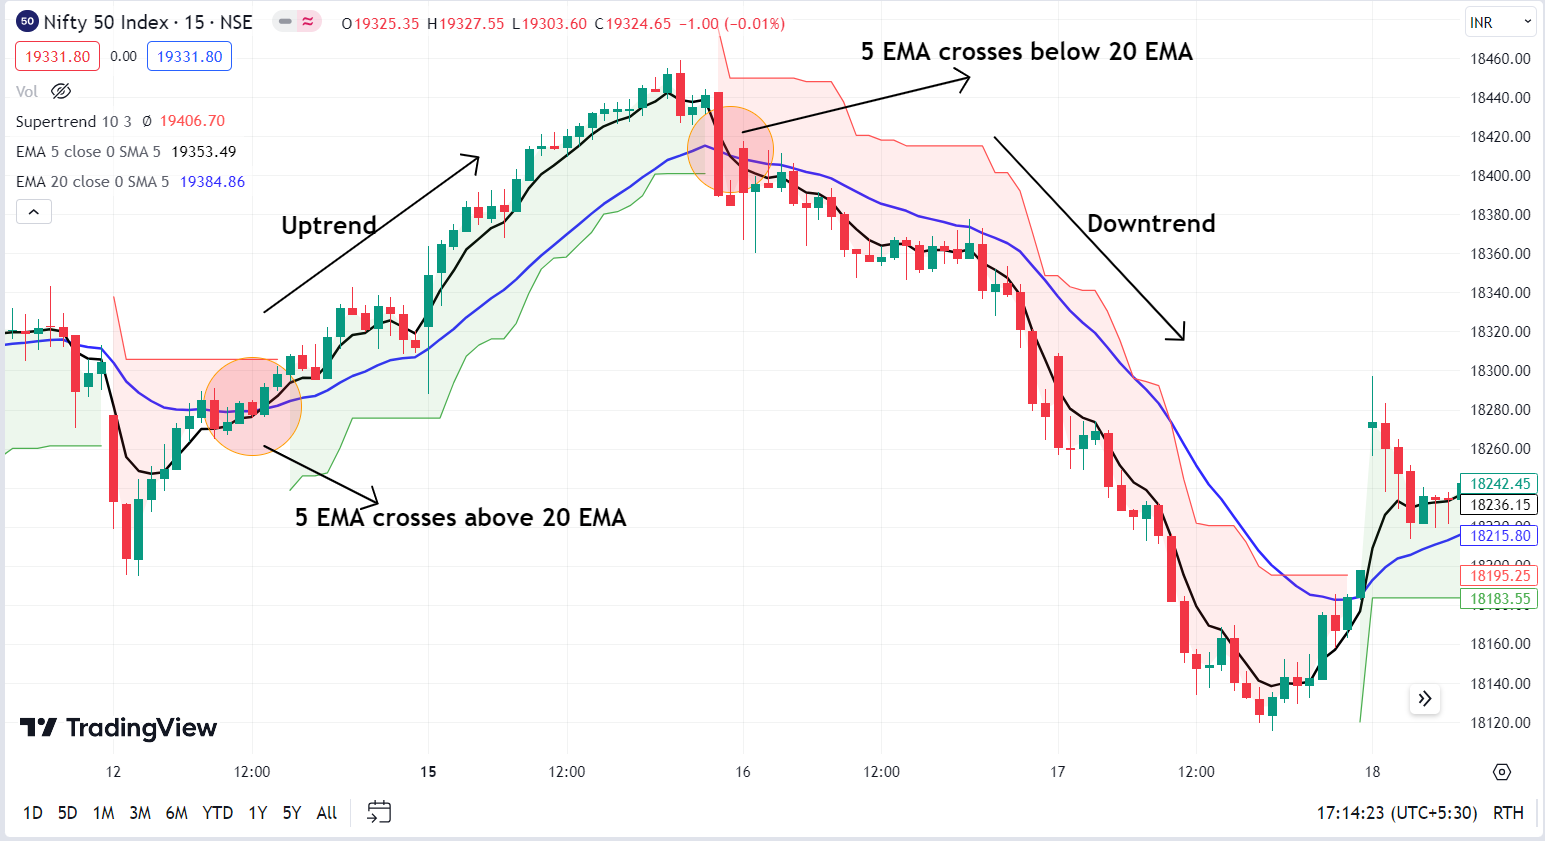
(Source: TradingView)
Chart of Nifty 50 index showing crossover strategy.
Advantages of Super Trend Indicator
- It is easy to identify buy and sell signals with red or green colours on charts.
- The super trend indicator is used to find support and resistance levels to find entry or exit points and place stop loss to manage the risks involved in the trades.
- It can be used in conjunction with other indicators like Moving averages, MACD, RSI etc to find logical entry/exit signals.
Disadvantages of Super Trend Indicator
- The super trend indicator doesn’t suit range-bound markets as it is a trend-following indicator.
- It is a lagging indicator.
- The delayed signals can lead to exit early or missing out on entry positions of the security in trending markets.
In Closing
We have discussed the what is super trend indicator, calculation, strategies, how to use, advantages and disadvantages of the super trend indicator in detail.
The super trend indicator is a good technical analysis tool to be used by market participants to analyse and build strategies with better-informed decisions to find good entry or exit opportunities.
For intraday time frames shorter period is preferred, the indicator can be adjusted to any of the time frames based on the trader’s strategies.
It is always advised to use other technical analysis tools along with a super trend indicator for better views on price movements to enter a safe trade with good risk management.
Written by Deepak M
By utilizing the stock screener, stock heatmap, portfolio backtesting, and stock compare tool on the Trade Brains portal, investors gain access to comprehensive tools that enable them to identify the best stocks also get updated with stock market news, and make well-informed investment decisions.


