

Williams Fractal Indicator: The price movement of the security help traders to identify opportunities in future directions with the help of technical analysis tools.

Trending markets are best suited to take long or short position for better profits. Among all the indicators, one of the technical indicators to use in trending markets is the Williams Fractal indicator.
In this article, we shall discuss the meaning, trading strategies and applications of the Williams fractal indicator.

What is Williams Fractal Indicator?
The Williams Fractal indicator is a technical analysis tool which identifies price trends and reversals by analysing the highs and lows formed with at least 5 candles in price charts.
It was developed by a famous trader Bill Williams and referred to as Williams fractal indicator. Generally in mathematics, fractal means similar patterns recurring progressively on small scales.

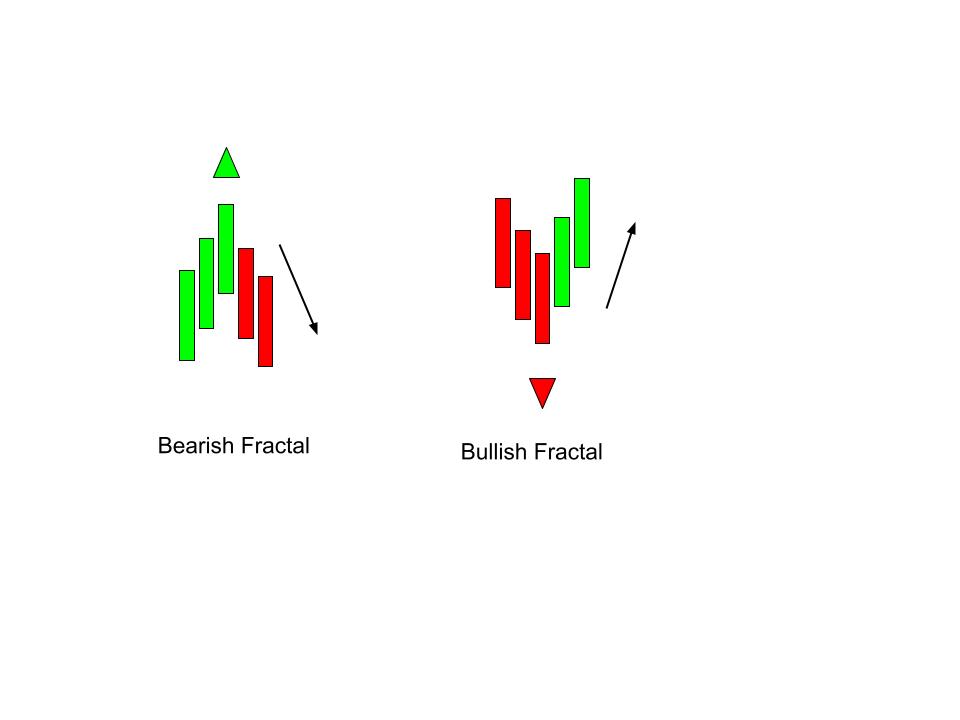
The Down arrow formed in a fractal indicator indicates a bullish signal in the price of a security and if the up arrow is formed the indicator signals a bearishness in the price of the security.
Formulation of Williams Fractal Indicator
Bullish Fractal = Low(N) < Low(N – 2)
and Low(N) < Low(N – 1)

and Low(N) < Low(N + 1)
and Low(N) < Low(N+ 2)
Bearish Fractal = High(N) > High(N – 2)
and High(N) > High(N – 1)
and High(N) > High(N + 1)
and High(N) > High(N + 2)
Where,
N = High or Low of the candle
N – 2 = High or Low of two candles to the left of N.
N – 1 = High or Low of one candle to the left of N.
N + 1 = High or Low of one candle to the right of N.
N + 2 = High or Low of two candles to the right of N.
Formation of Williams Fractal indicator
The indicator is formed of 5 or more candles.
When the price of security forms a three higher high candle followed by two candles with a lower high than the high of previous candles, this formation in the price chart indicates a bearish fractal pattern which signals a trend reversal to the downside in the security.
When the price of security forms three lower low candles followed by two candles with higher lows than the low of the previous candles, this formation indicates a bullish fractal pattern which signals a trend reversal to the upside in the security.
Trading Strategies with Williams Fractal Indicator
Entry or exit opportunities can be identified in the security with Williams fractal indicator alone or also a combination with other technical analysis tools like chart patterns, candlestick patterns and Indicators.
How to trade with Williams Fractal Indicator?
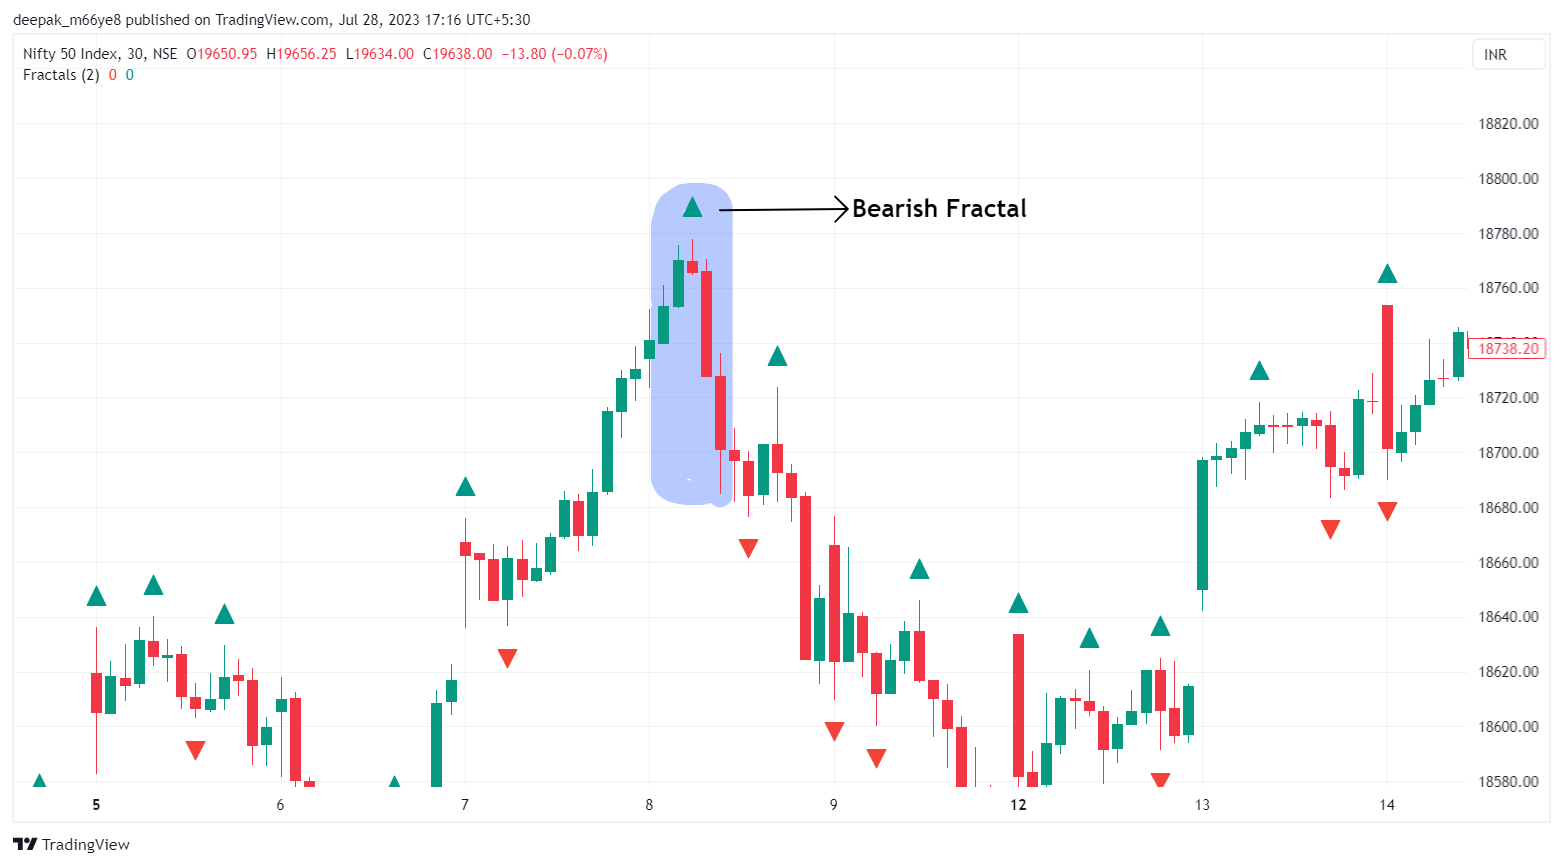
The indicator is available on all charting platforms for easy use, once applied the bullish fractal and bearish fractal will be highlighted on the chart.
Bullish Fractal
- The entry in the bullish fractal is after the complete formation of the pattern.
- The stop loss in a bullish fractal can be the low of the middle candle of the complete pattern formed.
- The profit target will be based on the risk-reward ratios of the trader’s setup.

Bearish Fractal
- The entry to the short side in a bearish fractal is after the complete formation of the pattern.
- The stop loss in a bearish fractal pattern can be the high of the middle candle of the complete pattern formed.
- Traders can set profit targets for the trade based on the risk-to-reward ratios.
Fibonacci retracement with Fractal indicator
It is always preferred to use the indicators in conjunction with other technical tools. Here Fibonacci retracement is combined with fractal indicators for potential views on entry and exit opportunities.
Fibonacci retracement levels are the horizontal lines which indicate the support and resistance levels on the price chart.
The percentage values signify the price retracement in opposite direction of prior movement. The standard Fibonacci levels used are 23.6%, 38.2%, 61.8% and 78.6%.
Fibonacci retracement and Fractal indicator are combined together to spot the point of entry in a security.
Hence traders can enter a long position in the security with double confirmation of Fibonacci and fractal with better risk-reward ratios.
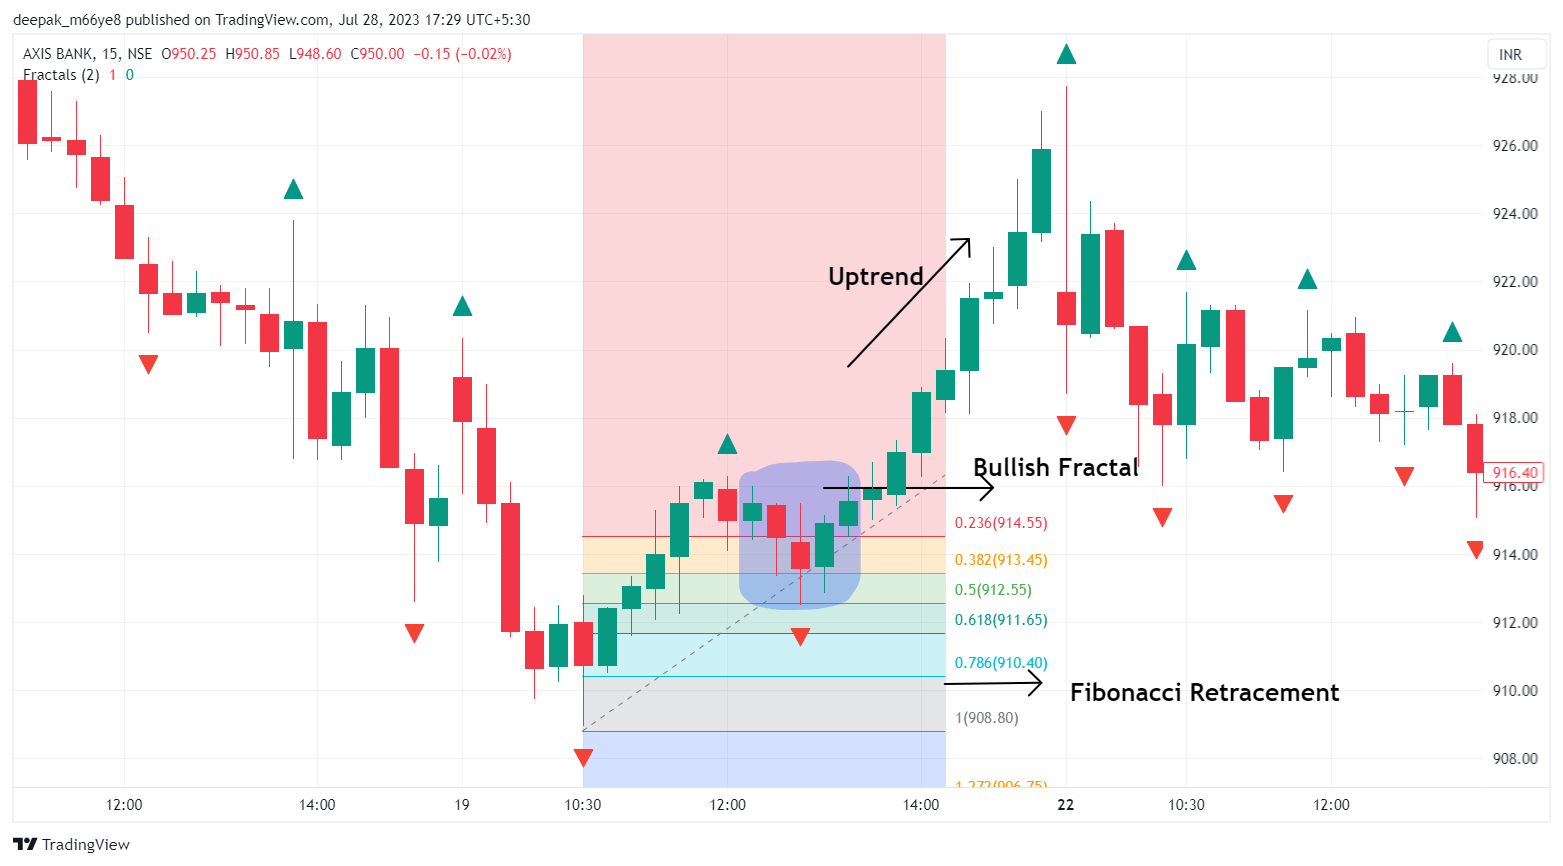
Axis Bank chart with the combination of Fibonacci retracement and bullish fractal.
William Fractal Indicator time frames
The indicator can be adjusted to any of the time frames based on long-term or short-term views.
A longer time period shows fewer signals on the chart indicating potential reversals in security.
For intraday 15min, 30min or hourly time frames are preferred.
Limitations of Williams Fractal Indicator
- It is a lagging indicator as two candles should be closed after the formation of the signal.
- The shorter time frames show more signals of bearish fractal and bullish fractal which may lead to over trading.
- The indicator is preferred in trending markets compared to sideways markets to avoid false signals.
- For better and potential signals, traders can’t rely completely on the indicator itself, hence it is preferred to combine it with other technical tools.
In Closing
The above learnings arrive at the conclusion that the indicator is best to identify potential reversals with entry or exit opportunities. The Williams fractal indicator is best used in trending markets to identify bullish and bearish reversals in the price of the security.
Traders are always advised to use the Williams fractal indicator in combination with other technical analysis tools to build a better strategic view of the price movements.
Written By Deepak
By utilizing the stock screener, stock heatmap, portfolio backtesting, and stock compare tool on the Trade Brains portal, investors gain access to comprehensive tools that enable them to identify the best stocks also get updated with stock market news, and make well-informed investment decisions.


