
Hey fellow readers! Today’s topic of concentration is how do analysts perform the Boston Consulting Group – BCG Matrix Analysis on companies! Initially, it might seem like a big deal but the truth is, with a little knowledge and awareness, any layman can execute the BCG analysis to get an apparent outlook about the company. Applying this Analysis on a company can also help an individual to gain an edge if they are particularly looking to invest in the company! Well, without much adieu, let’s dive in!

Boston Consulting Group Analysis
The Boston Consulting Group is a management consulting firm that was founded in 1963. It helps organizations to improve their performance by working on the key areas like the right implementation of technology, development of strategies and improvement in operational services.
As a result of their exposure and relationships with top-notch organizations, they are supremely aware of the industry’s best practices. In Fortune Magazine‘s 2007 Survey of “100 Best US Companies to Work For”, Boston Consulting Group (BCG) has received the 8th rank amongst all for their immense contribution.

In the year 1970, BCG shaped up a Product Portfolio Matrix to assess long term growth opportunities in the business by analyzing the product lines and thereafter untap their real capabilities. Even after 49 years of its establishment, the BCG matrix still remains a priceless apparatus for assisting companies in reaping the visions.
The tool is employed in reference to the distribution of resources in appropriate segments and utilizes them in the marketing of brands, product administration, strategic management, and portfolio perceptivity. However, the method is also referred to as the Growth-Share Matrix.

BCG Matrix Dimensions
Let us now understand the Boston Consulting Group (BCG) matrix in a subjective way.
Growth-Share Matrix is a graphical planning tool for corporate and businesses where the company’s products and services are plotted on axes and conclude major business verdicts.
Two prominent dimensions like Competitive Position (Relative Market Share) and Industry Attractiveness (Growth Rate Of That Industry) are taken help to estimate the true capacity of a business brand portfolio and advice further investment programs. These two dimensions determine the likely profitability of the business portfolio in terms of required cash to back the unit and cash generated by it. The conventional agenda of the inquiry is to understand the areas of investment, divestment, and development.

It is one of the most accepted methods of Portfolio Analysis and segregates a firm’s product and services into a 2/2 Matrix or, into four quadrants. Each quadrant is labeled as low or, high according to their performance which is again further based on the Relative Market Share and Growth Rate Of The Market.
- The Horizontal Axis i.e. x-axis indicates the extent of the market share of a product and its consecutive firmness in the particular market. It also helps to quantify a company’s competitiveness.
- On the other hand, the vertical axis ie. y-axis indicates the growth rate of a product and its ability to grow in a particular market.
1. Relative Market Share
- A higher market share generally means higher cash return and the logic behind the allotment of this dimension is dependent on its relationship with the experience curve.
- The usual notion is that when the company generates more number of products, it enjoys the advantage of low input costs and leads to increased profits.
- The market share of a company is always taken into consideration in relation to the marker share its major peer.
- It reveals the brand’s position amongst its competitors and is a subtle indication of its future prospects.
2. Market Growth Rate
- A high growth rate in the market is an indication of higher earnings and higher profits.
- It also refers to a higher level of investment in the product lines. This is a positive sign of consistent growth and an expectation to get a handsome return on investment.
- The market growth rate gives us significant data about the position of the brand other than the cash flow.
- It is also a reliable parameter of the stability of the market and attractiveness of the industry.
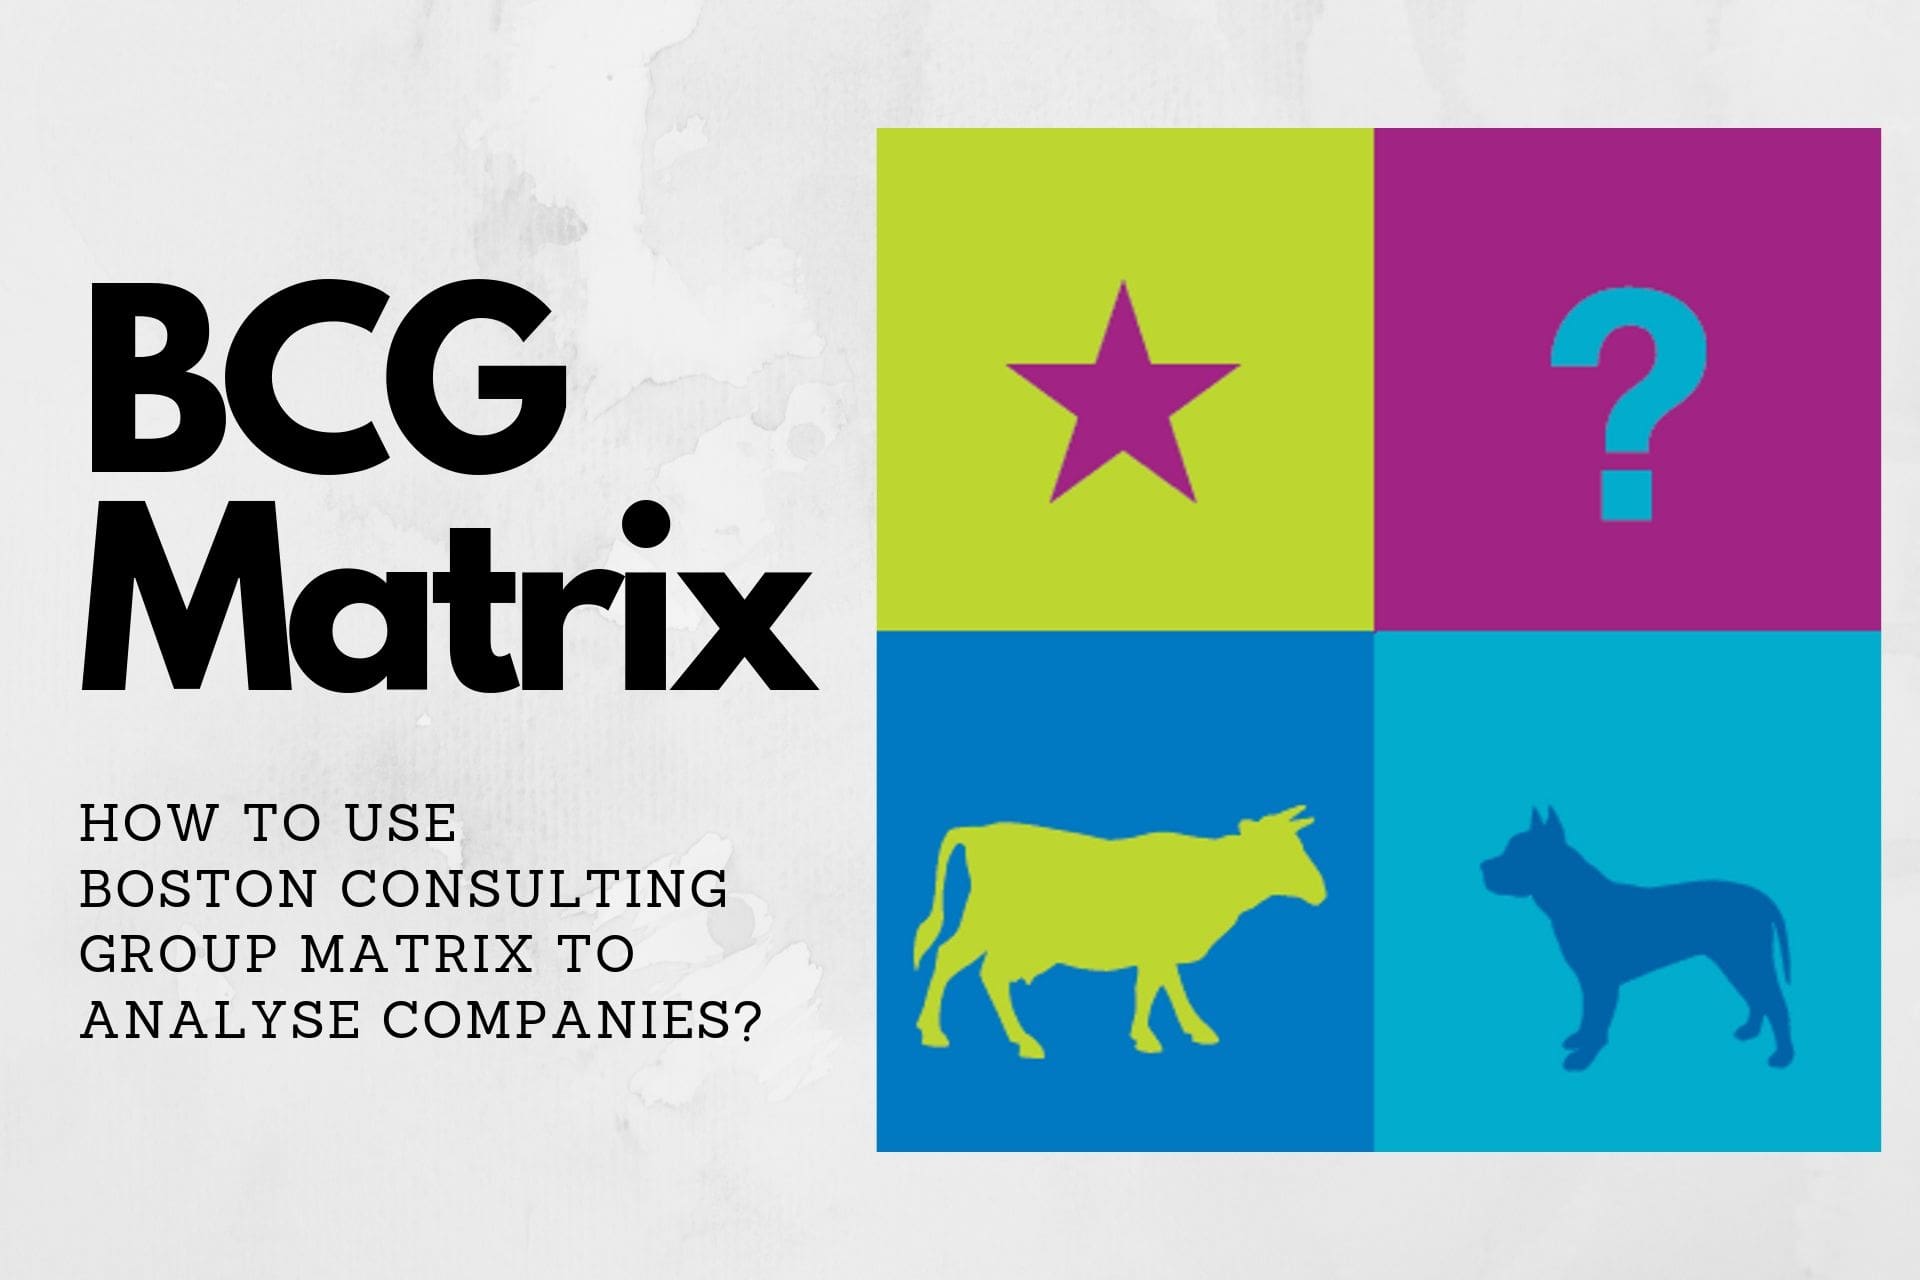
In addition, the four quadrants in the Growth-Share Matrix are as follows: Stars, Question marks, Cash cows, Dogs

The postulation of the Growth-Share Matrix is that an increment in the relative market share will lead to higher cash flow.
Firms acquire an upper hand from using economies of scale and yields a cost advantage in relation to its competitors. The growth rate of the market differs from industry to industry where growth rates more than 10% are seen as high while growth rates less than 10% are seen as low.
Also read: SWOT Analysis for Stocks: A Simple Yet Effective Study Tool.
BCG Matrix Breakdown
1. The BCG Matrix: Stars
Stars are business entities that have a mammoth market share in a fast-pacing industry. These product lines have a crystal clear niche and need sound investment to maintain their market position, push growth, and carry out a competitive advantage. Stars absorb a considerable amount of cash and also spawn huge cash flows.
Investments in the Stars can be a wise decision since they are the primary units and are awaited to become Cash Cows. Generation of positive cash flow takes place as the market reaches its mature stage and the products successfully retain their dominant position. Stars are the prized possession of a company and are placed in the top categories in a firm’s product portfolio.
Anyways, not all Stars end up as Cash Flows because random new products can soon be outjumped by innovative technological advancements in the course of rapidly dynamic industries. The strategic choices which can be incorporated are Vertical integration, market penetration, horizontal integration, product development, and market development.
2. The BCG Matrix: Question Marks
Question Marks are those business entities that have low market shares in a fast pacing market. Question marks are the most managerially radical products and need pervasive investment and resources to escalate their market share. They also need extensive monitoring because investments in question marks are broadly funded by cash flows.
Question marks do not always see the lights of success and even after the colossal amounts of investments they toil hard to gain market share and gradually transform into dogs. The natural or, typical cycle for most products in that they flag off their journey as Question Marks and eventually become stars with the clarification in their position.
When there is a slowdown in market growth, they metamorphose into Cash Cows and finally, the Cash Cow turns into Dogs. The strategic choices which can be incorporated are Market Development, Market Penetration, Product Development, and divestiture.
3. The BCG Matrix: Cash Cows
The product lines under the Cash Cows Quadrant has an enormous share of the market in a sluggish -growing industry. In this case, the generation of the revenue outpasses the initial investments which are necessary to preserve their business. Products in the cash cows quadrant are looked up to as products that are the leadmen in the market. These products already have an important chunk of investments and do not demand more investments to withhold their position.
Cash cows are termed as the most prosperous brands and should be “milked” to generate consistent cash flow as much as possible. These Cash flows are generally utilized to finance Stars and Question Marks to nurture their future growth. It is advised by different Financial Analysts that corporates should invest less in Cash Cows and reap the generated profits from the existing products.
However, this point always doesn’t hold true as Cash Cows are usually big corporations that are proficient in creating new products that might become Stars in the long run. The strategic choices which can be incorporated are product development, diversification, divestiture, retrenchment.
3. The BCG Matrix: Dogs
Dogs are those business entities that have a scanty market share in a ripened and slow-growing market. Products falling under the dogs quadrant are somehow able to protract themselves by initiating cash flows and sustain the market share.
Usually, this unit is mainly valueless to the company in terms of earning capability. However, it might give rise to other small scale benefits such as the production of jobs and mutualism that help other business units. Firms sell off products belonging to the Dogs Quadrant unless the products are complementary to existing products or are used to act as a shield to oppose the moves of the competitors.
According to financial analysts, corporate should avoid investing in such product lines because they lead to negative cash returns. Dogs can massively affect the investors’ sentiments and their personal views about the management of a company. The strategic choices which can be incorporated are retrenchment, Divestiture, and Liquidation.
According to the Boston Consulting Group, a branched out company with an equitable portfolio is in the standardized gallery to utilize its strengths to capitalize on the opportunities of expansion and multiplication. However, an equitable portfolio is one which has
- Stars to embolden future success.
- Question marks that have a probability to turn into Stars with some consideration, management, and investment.
- Cash cows to generate funds for future growth.
BCG Matrix Analysis
Now that we have gained an insight into the basics of BCG Matrix, let us now learn the steps for its application.
1. Choose the unit:
Strategic Business Units(SBU), Independent Brands, Product Lines or the Firm as a unit can be researched using the BCG matrix. The selected unit steers the whole analysis and crucial definitions. As the market, industry, competitors, and position will all be driven based on the chosen unit, it is extremely important to define the unit demarcated for analysis.
2. Define the market
The most momentous stage for the entire matrix is the key definition of the market. An erroneously defined market will make way for an erroneous classification of the unit. Suppose, if we would do the analysis for the Gucci dresses in the regular clothing market it would end up as a Dog but it would be a Cash Cow in the luxury clothing sector. Therefore, It is a major task to transparently explain the market in order to get a solid grip on a firm’s portfolio position.
3. Calculation of Relative Market Share
Relative Market Share can be enumerated in terms of revenues or, market share. It is calculated by dividing the brand’s market share by the market share of the market leader/supreme competitor in an industry.
For example, if the competitor’s market share in the automobile industry is 37% and a firm’s brand market share is 13% in a year, the relative market share would amount to 0.35.
4. Calculation of Market Growth Rate
The growth rate of an industry can be found from the industry reports released every year and are put up on official websites. It can also be calculated by considering the average revenue growth of the leading industrial enterprises. However, it is to be kept in mind that the growth rate of a Market is expressed in terms of percentage.
5. Draw the circles on a matrix
After calculating all the parameters, one can easily plot the brands on the matrix. The plotter should draw a circle for each brand within a unit, or for all the brands in a company. The size of the circle should be in proportion to the generated revenue of the brand.
Let’s apply these steps to analyze an India Company!

For ease of understanding the concept, we are taking ‘Amul’ a well-known company in India as our example.
Amul brand is a prominent and popular name in the dairy industry in India. It produces milk, butter, and other dairy-related products and successfully caters to the Indian population.
The exercise of BCG Matrix on the brand can furnish critical information about the products and the product lines that are a pivotal source of revenue for the organization. The BCG matrix for Amul is as follows:
1. Stars
The products which are considered as Stars of Amul are Amul Ice cream and Amul Ghee. These two products have a high market share and have adequate possibilities to grow in the near future. Amul Ghee has also been a Star for the company as the brand has been able to acquire a 30% hike in its sales while the market share clinged by the product is around 18% along with a yearly turnover of more than Rs 1,700 Crores.
2. Question Mark
Amul Lassi is diagnosed as a Question Mark as their capability as a major derivation of profitability remains quite bleak. Amul lassi has been brought about in the market with the agenda to magnify the market share and give a tough competition with the other beverages available in the market. The healthy milk from Amul possesses a huge potential to swell in the future considering the expansion of interest and demand for healthy products, refreshments, and beverages.
3. Cash Cows
There are three products under the umbrella of Amul that come under the Cash Cow category and they are Amul Milk, Amul Butter, and Amul Cheese. The market share of these products is not likely to undergo colossal gains but their current spot makes them a high revenue contributor.
4. Dogs
Amul has two products that have not been able to generate sales and revenues as per the estimation. One of the noteworthy examples in this regard is Amul Chocolates and Amul Pizza. The competitors make it tough to amplify the market shares to a notable degree which can turn this product to become an outstanding source of sustainable revenues. However, if the sales figures do not proceed towards betterment, a probable measure would be to take the path of divestment of the above-mentioned brands.
Benefits of BCG Matrix Analysis
Every theory and model exiting in the books have their pros and cons. Similarly, Boston Consulting Group( BCG) has its own set. Here are a few of the benefits of BCG Matrix:
- The BCG Matrix is beneficent for managers to assure a balance in the companies’ current portfolio consisting of Stars, Cash Cows, Question Marks, and Dogs.
- BCG-Matrix is befitting to large-cap companies that usually look for volume and experience effects.
- The model is coherent and easy to apply and also provides a base for management to take decisions and jack up for future activities.
Limitations of BCG Matrix Analysis
Here are a few of the common limitations of using BCG matrix for analyzing companies:
- Growth-share analysis has been highly disapproved of for its simple calculations and absence of a fruitful application.
- Market share and Industry Growth are not the sole factors of profitability. Besides, high market share always does not mean high profits.
- This matrix does not take into consideration any other factors that may have an effect on both competitive advantage & industry attractiveness.
- It denies the correlation between different existing units. In reality, products under Dogs may be assisting another unit to gain a competitive advantage.
- The definition of a market is taken from a broader perspective and often neglects smaller aspects.
Summary
Let us quickly summarise what we discussed in this article. The Boston Consulting Group (BCG) is a management consulting firm that helps organizations to make informed decisions from the business point of view.
They introduced the Growth-Share Matrix which is a designing and a planning tool that prepares graphical representations on the basis of a company’s products and services. The Growth-Share Matrix categorizes a firm’s products into four divisions namely Dogs, Cash Cows, Stars, and Question Marks. The four divisions are based on the Relative Market Share and Growth Rate Of The Market. This Matrix immensely helps the company to make decisions regarding investment, divestment, liquidity, and retrenchments.

