
by Trade Brains | May 9, 2024 8:00 am | Stock Analysis
Bearish Harami Candlestick Pattern: Technical analysis is a method for forecasting future price movements using previous market data, with a primary focus on price and volume. Candlestick patterns stand out as visual representations of price activity over a set span....
by Trade Brains | April 29, 2024 4:00 pm | News
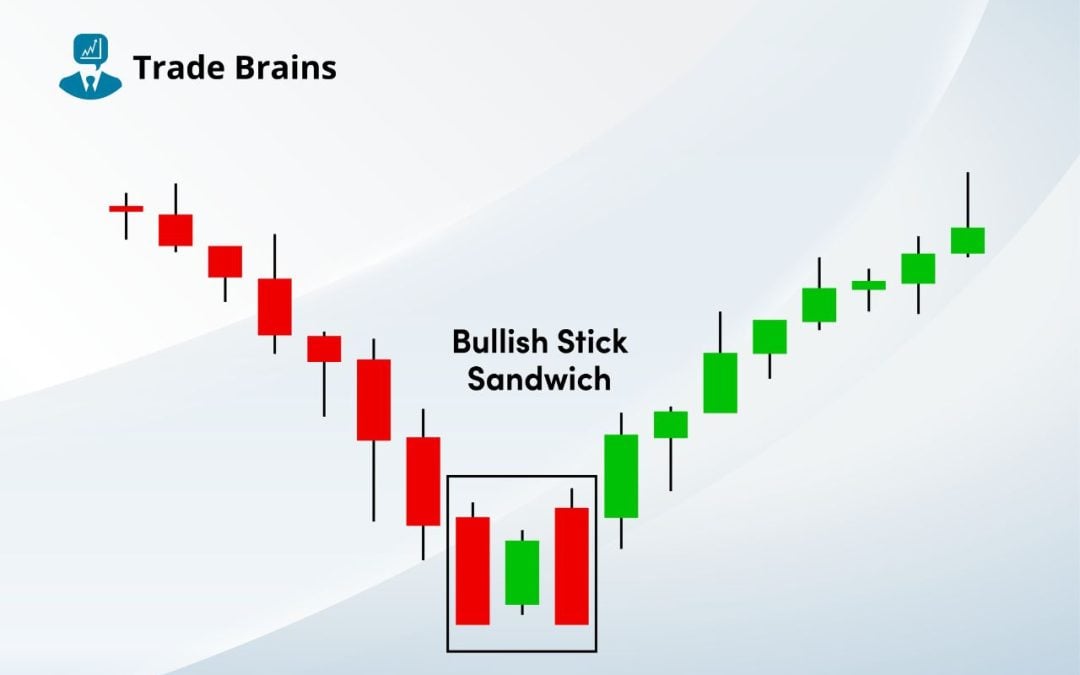
Bullish Stick Sandwich Pattern: Technical analysts rely upon chart and candlestick patterns to analyze the price of the stock and predict its future movement. Each pattern formed in the market has a reason behind its formation and gives an indication. There are a few...


