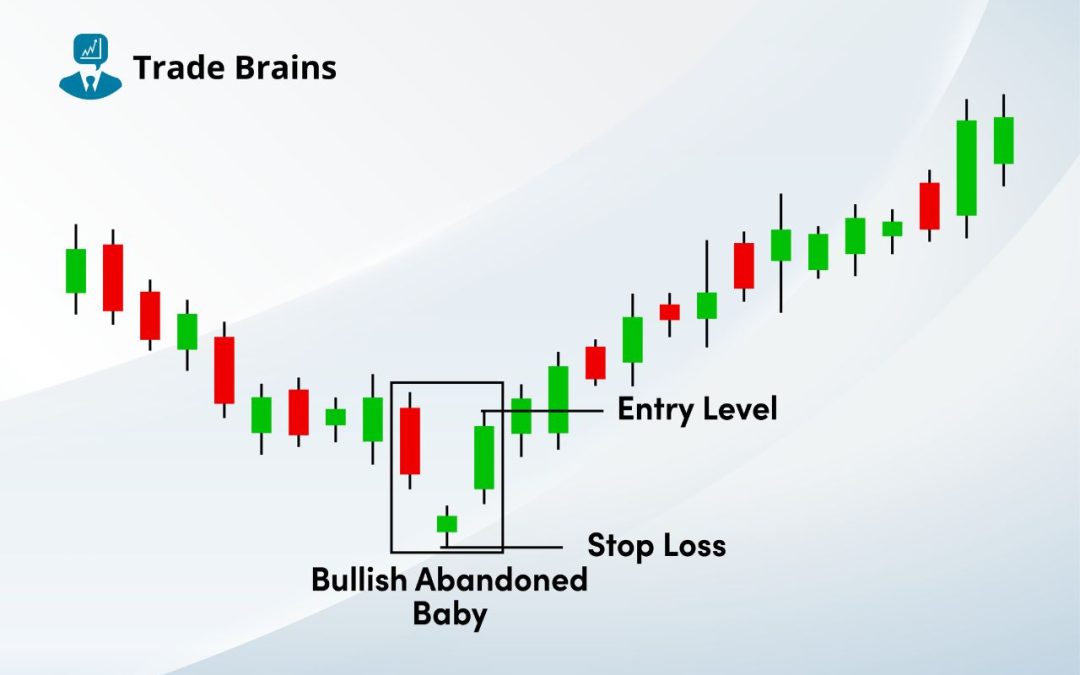
Bullish Abandoned Baby Candlestick Pattern: Technical analysis is a technique for projecting future price movements based on historical market data, with a particular emphasis on price and volume. Candlestick patterns are distinctive visual representations of price...
Morning Doji Star Candlestick Pattern: Candlestick patterns are distinctive visual representations of price action over a specific period. These patterns, formed by open, high, low, and close prices, give insights into market sentiment and potential trend reversals or...
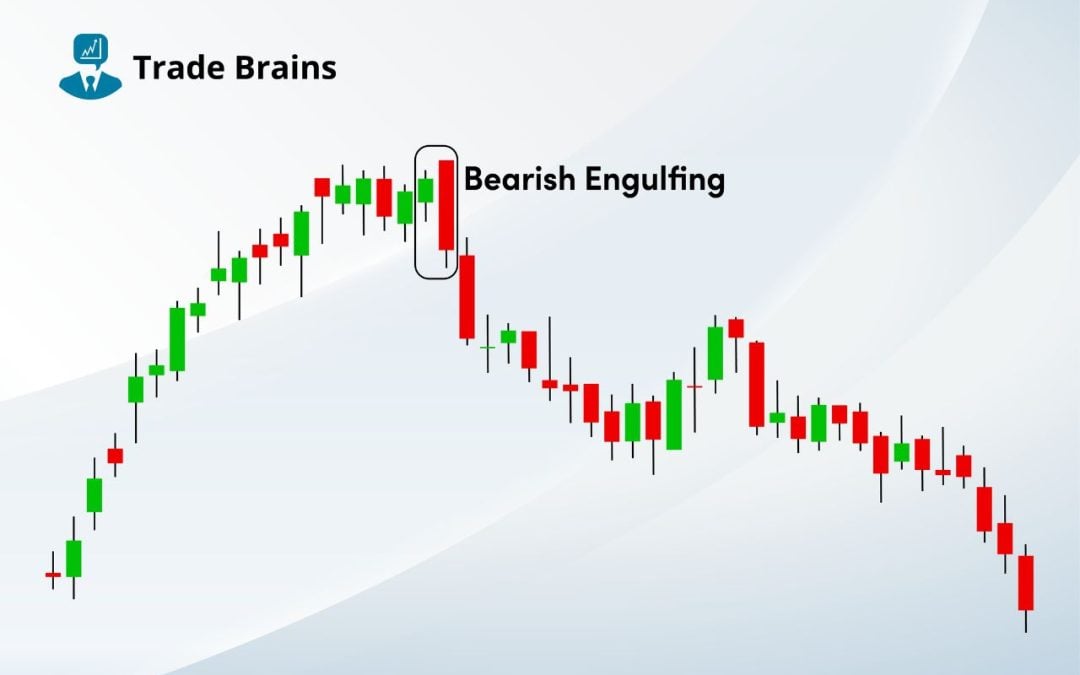
Bearish Engulfing Candlestick Pattern: Technical analysts rely heavily on chart and candlestick patterns to conduct comprehensive analyses of stock prices and accurately predict their future movements. Each pattern formed in the market has a clear and justified reason...
Bearish Harami Candlestick Pattern: Technical analysis is a method for forecasting future price movements using previous market data, with a primary focus on price and volume. Candlestick patterns stand out as visual representations of price activity over a set span....
Bearish Harami Cross Candlestick Pattern: Traders rely on technical analysis to analyze and predict the future movement of the price in the market. Candlestick patterns are a part of technical analysis preferred by traders to understand and predict the future price...
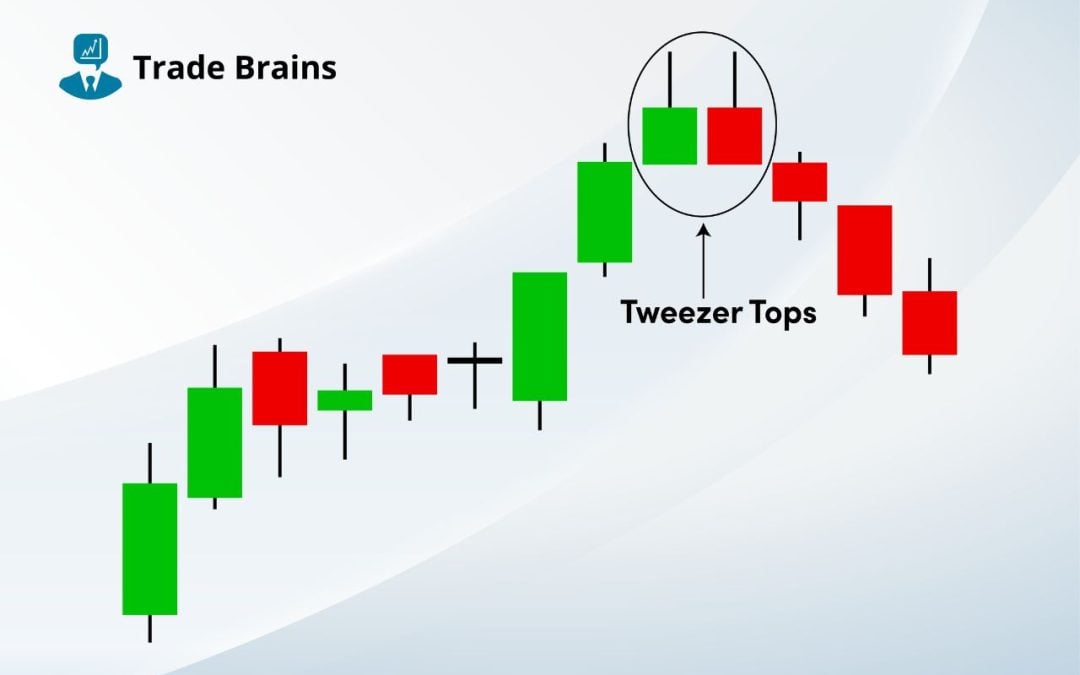
Tweezer Top Candlestick Pattern: Traders rely on technical analysis to analyze and predict the future movement of the price in the market. Candlestick patterns are a part of technical analysis preferred by traders to understand and predict the future price movement in...
Bearish Stick Sandwich Pattern: Technical analysts heavily rely on chart and candlestick patterns to conduct a thorough analysis of stock prices and accurately predict their future movements. Each pattern formed in the market has a clear and justified reason behind...
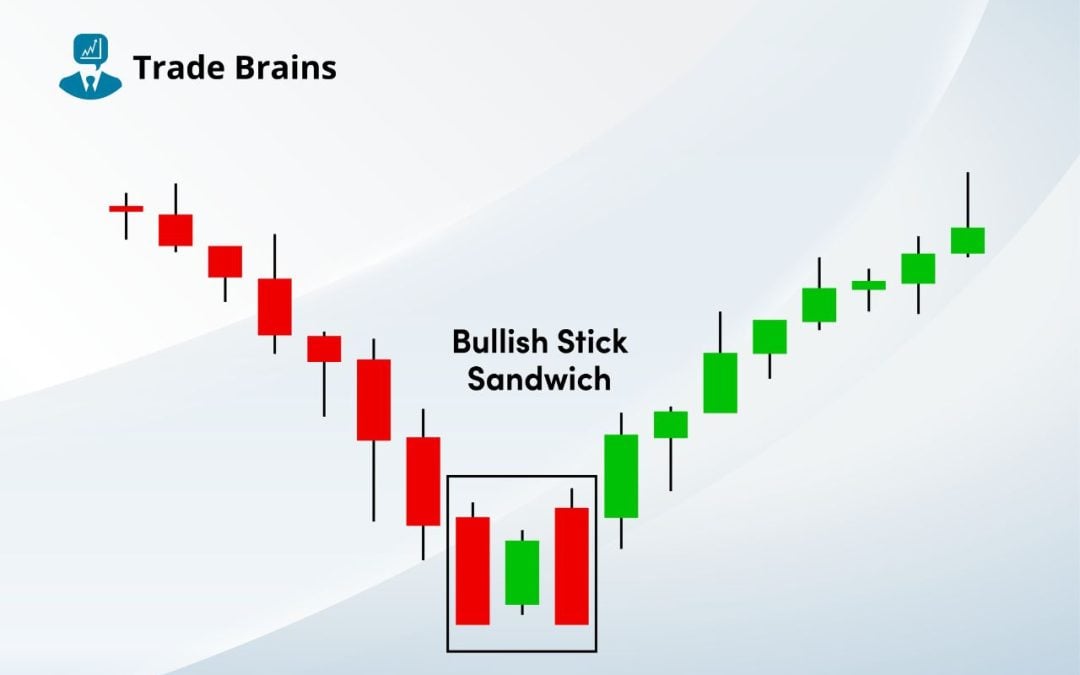
Bullish Stick Sandwich Pattern: Technical analysts rely upon chart and candlestick patterns to analyze the price of the stock and predict its future movement. Each pattern formed in the market has a reason behind its formation and gives an indication. There are a few...
Falling Window Candlestick Pattern: In the field of stock market analysis, technical analysts utilize chart and candlestick patterns to assess stock prices and project future trends. Each pattern holds valuable information that provides insight into the market’s...
Bearish Thrusting Candlestick Pattern: Technical analysis is a key method for market participants speculating on the movement in the price of stock. It consists of multiple methods to predict price movement. These methods were developed based on the historical...
Best stock discovery tool with +130 filters, built for fundamental analysis. Profitability, Growth, Valuation, Liquidity, and many more filters. Search Stocks Industry-wise, Export Data For Offline Analysis, Customizable Filters.