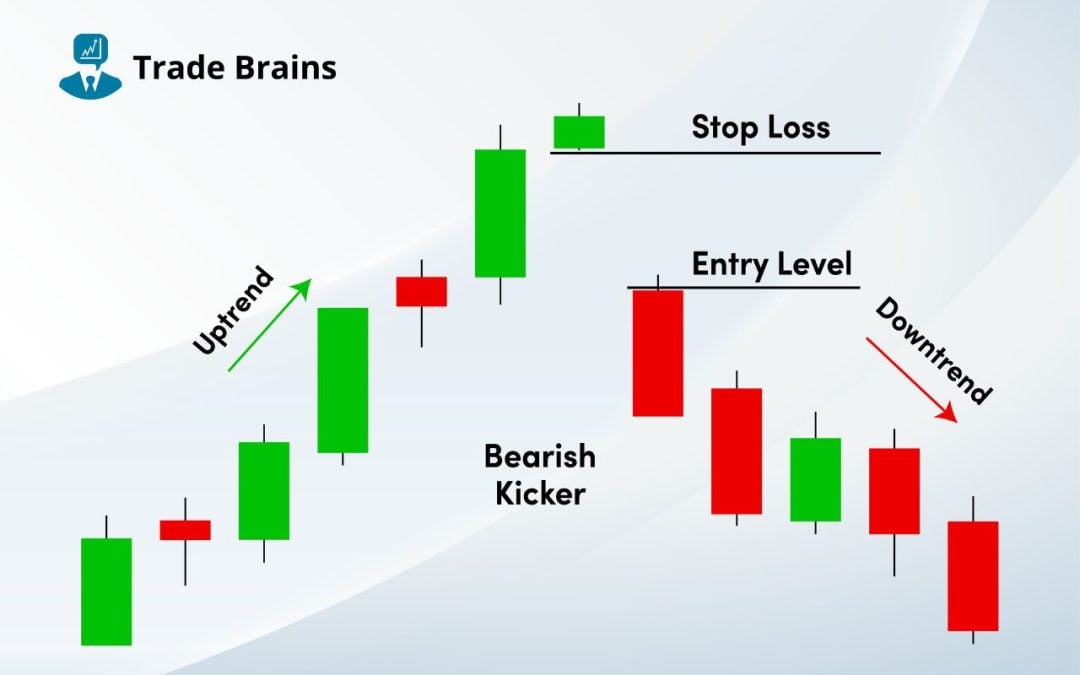
Bearish kicker candlestick pattern: It is often observed that market participants utilize technical analysis as a means of speculating and predicting short-term movements in stock prices. Technical analysis encompasses a range of methods for analyzing the market,...
Bearish Marubozu Candlestick Pattern: traders and speculators rely on technical analysis to analyze and predict the future movement of the price in the market. Candlestick patterns are a part of technical analysis preferred by traders to understand and predict the...
Bearish Counterattack Candlestick Pattern: Candlestick patterns are a part of technical analysis preferred by traders to comprehend and predict the future price movement in securities. Among various patterns, the Bearish Counterattack Candlestick Pattern is a...
Bullish thrusting candlestick pattern: By examining historical trends, technical analysts predict changes in stock prices. Candlestick patterns are one such method, which examines price movement during a specific timeframe to identify historical trends and project...
Shooting Star Candlestick Pattern: Technical analysis is utilized by investors to estimate the movements of stock prices based on past trends. One of the most popular methods of analysis is the candlestick pattern, which examines the shape and color of individual...
Hanging Man Candlestick Pattern: Investors use technical analysis to predict stock price movements based on historical trends. The candlestick pattern is a popular method that examines the shape and color of individual candlesticks to identify past reactions and...
Three white soldiers candlestick pattern: In the field of stock market analysis, technical analysts utilize chart and candlestick patterns to assess stock prices and project future trends. Each pattern holds valuable information that provides insight into the...
Bullish Marubozu Candlestick Pattern: Traders and speculators rely on technical analysis to analyze and predict the future movement of the price in the market. Candlestick patterns are a part of technical analysis preferred by traders to understand and predict the...
High Wave Candlestick Pattern: In the realm of technical analysis in financial markets, chart patterns play a crucial role in identifying potential trading opportunities. One such pattern that traders often encounter is the high wave pattern. In this article, we will...
Bullish Counterattack Candlestick Pattern: Candlestick patterns are a part of technical analysis preferred by traders to understand and predict the future price movement in securities. Among various patterns, the Bullish Counterattack Pattern is a two-candlestick...
Best stock discovery tool with +130 filters, built for fundamental analysis. Profitability, Growth, Valuation, Liquidity, and many more filters. Search Stocks Industry-wise, Export Data For Offline Analysis, Customizable Filters.